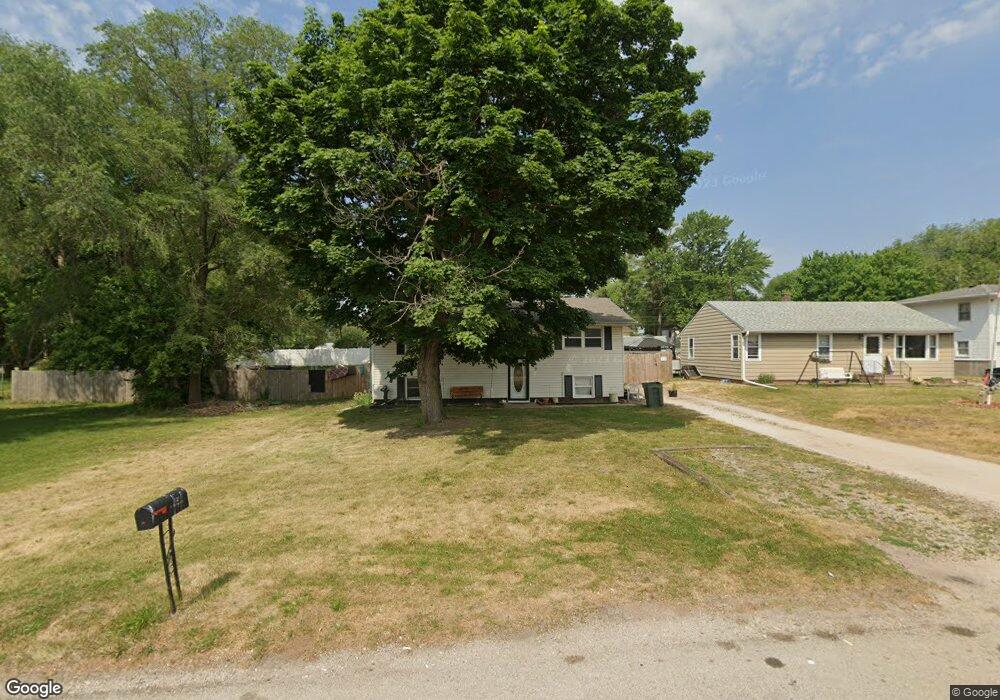
525 S 3rd St Colona, IL 61241
Estimated Value: $100,000 - $134,000
3
Beds
--
Bath
912
Sq Ft
$135/Sq Ft
Est. Value
About This Home
This home is located at 525 S 3rd St, Colona, IL 61241 and is currently estimated at $123,270, approximately $135 per square foot. 525 S 3rd St is a home located in Henry County with nearby schools including Colona Grade School, United Township High School, and East Moline Christian School.
Ownership History
Date
Name
Owned For
Owner Type
Purchase Details
Closed on
Mar 29, 2018
Sold by
Rogers Ricky D
Bought by
Dreifurst Jacob W and Dreifurst Christa A
Current Estimated Value
Home Financials for this Owner
Home Financials are based on the most recent Mortgage that was taken out on this home.
Original Mortgage
$76,500
Outstanding Balance
$69,897
Interest Rate
7.62%
Mortgage Type
Adjustable Rate Mortgage/ARM
Estimated Equity
$53,374
Purchase Details
Closed on
Nov 28, 2006
Sold by
Federal Home Loan Mortgage Corporation
Bought by
Rogers Ricky D
Home Financials for this Owner
Home Financials are based on the most recent Mortgage that was taken out on this home.
Original Mortgage
$55,150
Interest Rate
6.24%
Mortgage Type
New Conventional
Purchase Details
Closed on
Aug 9, 2006
Sold by
Mccoy A Lyndsic
Bought by
Federal Home Loan Mortgage Corporation
Create a Home Valuation Report for This Property
The Home Valuation Report is an in-depth analysis detailing your home's value as well as a comparison with similar homes in the area
Home Values in the Area
Average Home Value in this Area
Purchase History
| Date | Buyer | Sale Price | Title Company |
|---|---|---|---|
| Dreifurst Jacob W | $85,000 | Attorney | |
| Rogers Ricky D | -- | All American Esw & Title | |
| Federal Home Loan Mortgage Corporation | -- | None Available |
Source: Public Records
Mortgage History
| Date | Status | Borrower | Loan Amount |
|---|---|---|---|
| Open | Dreifurst Jacob W | $76,500 | |
| Previous Owner | Rogers Ricky D | $55,150 |
Source: Public Records
Tax History Compared to Growth
Tax History
| Year | Tax Paid | Tax Assessment Tax Assessment Total Assessment is a certain percentage of the fair market value that is determined by local assessors to be the total taxable value of land and additions on the property. | Land | Improvement |
|---|---|---|---|---|
| 2024 | $2,565 | $34,320 | $2,907 | $31,413 |
| 2023 | $2,466 | $31,807 | $2,694 | $29,113 |
| 2022 | $2,234 | $28,915 | $2,449 | $26,466 |
| 2021 | $2,321 | $29,501 | $3,554 | $25,947 |
| 2020 | $2,197 | $28,011 | $3,374 | $24,637 |
| 2019 | $2,202 | $28,218 | $3,399 | $24,819 |
| 2018 | $2,163 | $28,050 | $3,379 | $24,671 |
| 2017 | $1,902 | $25,826 | $3,413 | $22,413 |
| 2016 | $1,865 | $25,494 | $3,369 | $22,125 |
| 2015 | $1,500 | $24,945 | $3,296 | $21,649 |
| 2013 | $1,500 | $24,408 | $3,225 | $21,183 |
Source: Public Records
Map
Nearby Homes