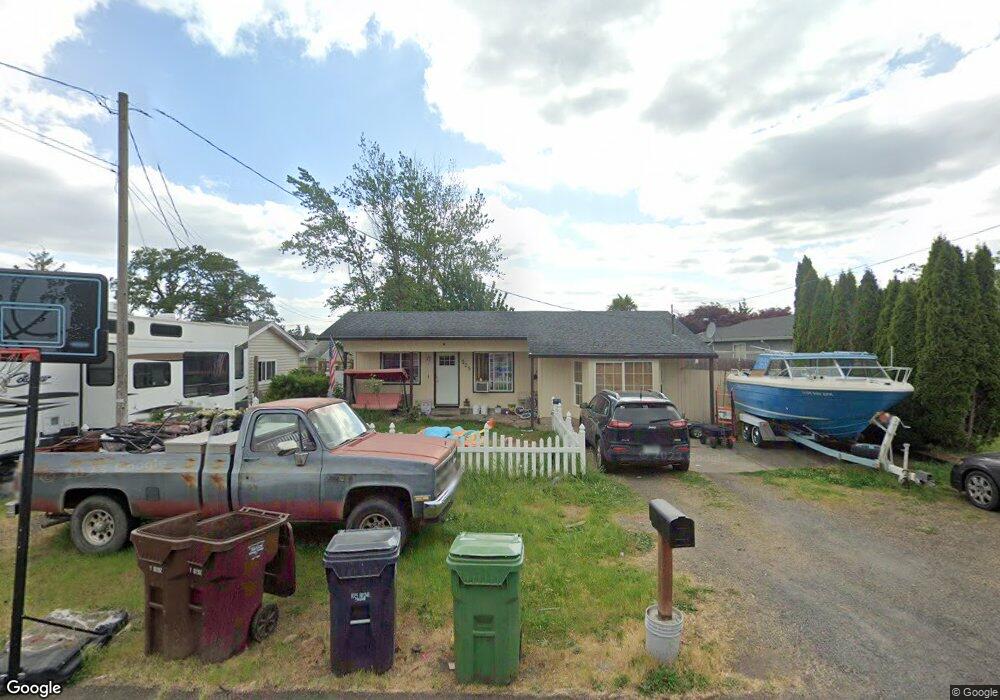
525 S 9th St Saint Helens, OR 97051
Estimated Value: $346,000 - $390,000
3
Beds
1
Bath
1,472
Sq Ft
$251/Sq Ft
Est. Value
About This Home
This home is located at 525 S 9th St, Saint Helens, OR 97051 and is currently estimated at $370,037, approximately $251 per square foot. 525 S 9th St is a home located in Columbia County with nearby schools including St. Helens High School and Columbia County Christian School.
Ownership History
Date
Name
Owned For
Owner Type
Purchase Details
Closed on
Jun 10, 2020
Sold by
Thorpe William C and Thorpe Kristine M
Bought by
Gardner Cari and Gardner Kenneth
Current Estimated Value
Home Financials for this Owner
Home Financials are based on the most recent Mortgage that was taken out on this home.
Original Mortgage
$262,626
Outstanding Balance
$232,798
Interest Rate
3.2%
Mortgage Type
New Conventional
Estimated Equity
$137,239
Purchase Details
Closed on
Jan 26, 2016
Sold by
Young Robert W
Bought by
Thorpe William C and Thorpe Kristine M
Purchase Details
Closed on
Oct 10, 2006
Sold by
Amick Francis and Amick Samantha
Bought by
Young Robert W
Home Financials for this Owner
Home Financials are based on the most recent Mortgage that was taken out on this home.
Original Mortgage
$151,905
Interest Rate
6.44%
Mortgage Type
Unknown
Purchase Details
Closed on
Sep 3, 2004
Sold by
Woodbury Gordon and Woodbury Dana
Bought by
Amick Francis and Amick Samantha
Home Financials for this Owner
Home Financials are based on the most recent Mortgage that was taken out on this home.
Original Mortgage
$102,800
Interest Rate
6.5%
Mortgage Type
Unknown
Create a Home Valuation Report for This Property
The Home Valuation Report is an in-depth analysis detailing your home's value as well as a comparison with similar homes in the area
Home Values in the Area
Average Home Value in this Area
Purchase History
| Date | Buyer | Sale Price | Title Company |
|---|---|---|---|
| Gardner Cari | $260,000 | Ticor Title | |
| Thorpe William C | $103,000 | Ticor Title | |
| Young Robert W | $159,900 | Ticor Title | |
| Amick Francis | $128,500 | Ticor Title |
Source: Public Records
Mortgage History
| Date | Status | Borrower | Loan Amount |
|---|---|---|---|
| Open | Gardner Cari | $262,626 | |
| Previous Owner | Young Robert W | $151,905 | |
| Previous Owner | Amick Francis | $102,800 | |
| Closed | Amick Francis | $25,700 |
Source: Public Records
Tax History Compared to Growth
Tax History
| Year | Tax Paid | Tax Assessment Tax Assessment Total Assessment is a certain percentage of the fair market value that is determined by local assessors to be the total taxable value of land and additions on the property. | Land | Improvement |
|---|---|---|---|---|
| 2024 | $2,305 | $143,870 | $62,760 | $81,110 |
| 2023 | $2,270 | $139,680 | $62,400 | $77,280 |
| 2022 | $2,177 | $135,620 | $60,580 | $75,040 |
| 2021 | $1,988 | $131,670 | $62,590 | $69,080 |
| 2020 | $1,922 | $127,840 | $54,410 | $73,430 |
| 2019 | $1,891 | $124,120 | $52,360 | $71,760 |
| 2018 | $1,833 | $120,510 | $63,150 | $57,360 |
| 2017 | $1,782 | $117,000 | $61,310 | $55,690 |
| 2016 | $1,755 | $113,600 | $59,530 | $54,070 |
| 2015 | $1,225 | $105,480 | $50,870 | $54,610 |
| 2014 | $1,310 | $109,230 | $47,070 | $62,160 |
Source: Public Records
Map
Nearby Homes
- 465 S 9th St
- 614 S 10th St
- 615 S 9th St
- 1324 Old Portland Rd
- 0 S 13th St Unit 15 23587676
- 0 S 13th St Unit 14 23207570
- 445 S 4th St
- 344 S 15th St
- 297 S 6th St
- 285 S 7th St
- 215 S 8th St
- 9670 Parcel
- 270 Cowlitz St
- 280 S 18th St
- 155 S 8th St
- 234 N 15th St
- 280 S 1st St
- 144 S 6th St
- 134 S 6th St
- 165 N 6th St