Estimated Value: $216,000 - $268,000
--
Bed
1
Bath
1,196
Sq Ft
$209/Sq Ft
Est. Value
About This Home
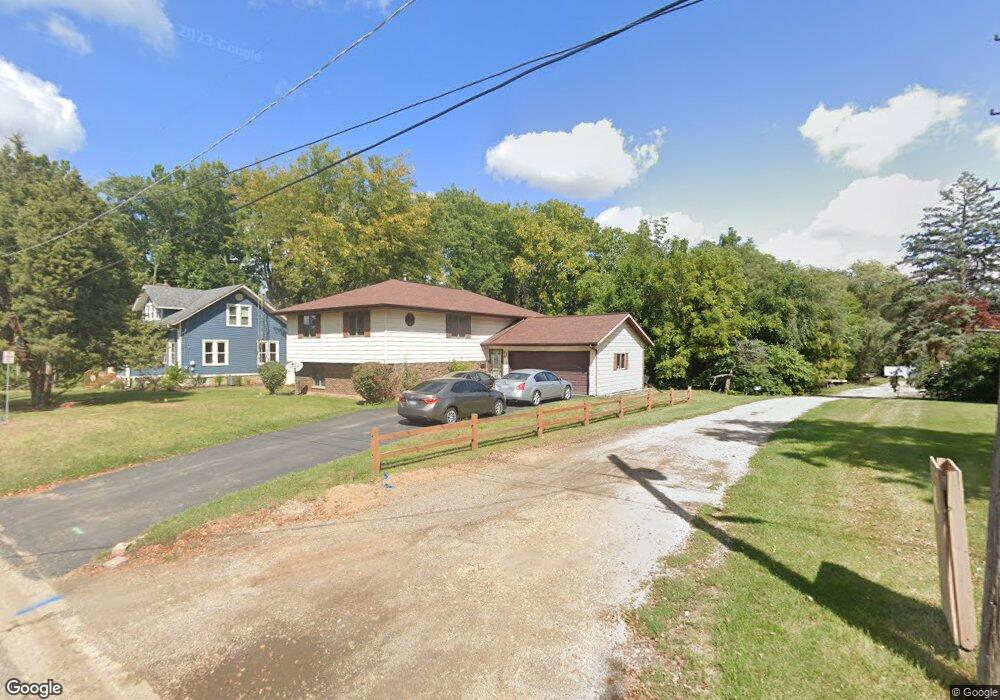
This home is located at 525 S Hale St, Plano, IL 60545 and is currently estimated at $249,381, approximately $208 per square foot. 525 S Hale St is a home located in Kendall County with nearby schools including P.H. Miller Elementary School, Centennial Elementary School, and Emily G. Johns School.
Ownership History
Date
Name
Owned For
Owner Type
Purchase Details
Closed on
May 6, 2022
Sold by
Nevarez Jesus H
Bought by
Nevarez Jesus H and Lopez Alma R
Current Estimated Value
Purchase Details
Closed on
Dec 21, 2016
Sold by
Albany Bank & Trust Co Na
Bought by
Debolt Brian E and Deboltz Armelinda
Purchase Details
Closed on
May 18, 2009
Sold by
Nevarez Jesus H and Nevarez Jose A
Bought by
Nevarez Jesus H and Nevarez Kendra J
Purchase Details
Closed on
Jun 30, 2000
Sold by
Parry David L and Parry Kimberly A
Bought by
Nevarez Jesus H and Nevarez Jose A
Home Financials for this Owner
Home Financials are based on the most recent Mortgage that was taken out on this home.
Original Mortgage
$120,800
Interest Rate
8.64%
Purchase Details
Closed on
Mar 1, 1996
Bought by
Parry Ii David L and Parry Kimberly A
Purchase Details
Closed on
Jun 1, 1991
Bought by
Dietzman Gerald E
Purchase Details
Closed on
Oct 1, 1987
Purchase Details
Closed on
Oct 1, 1986
Create a Home Valuation Report for This Property
The Home Valuation Report is an in-depth analysis detailing your home's value as well as a comparison with similar homes in the area
Home Values in the Area
Average Home Value in this Area
Purchase History
| Date | Buyer | Sale Price | Title Company |
|---|---|---|---|
| Nevarez Jesus H | -- | Krentz Salfisberg Swanson Hagg | |
| Nevarez Jesus H | -- | Swanason Haggard Pc | |
| Debolt Brian E | $15,000 | None Available | |
| Nevarez Jesus H | -- | None Available | |
| Nevarez Jesus H | $151,000 | -- | |
| Parry Ii David L | $133,500 | -- | |
| Dietzman Gerald E | $127,000 | -- | |
| -- | $98,000 | -- | |
| -- | $11,500 | -- |
Source: Public Records
Mortgage History
| Date | Status | Borrower | Loan Amount |
|---|---|---|---|
| Previous Owner | Nevarez Jesus H | $120,800 | |
| Closed | Dietzman Gerald E | -- |
Source: Public Records
Tax History Compared to Growth
Tax History
| Year | Tax Paid | Tax Assessment Tax Assessment Total Assessment is a certain percentage of the fair market value that is determined by local assessors to be the total taxable value of land and additions on the property. | Land | Improvement |
|---|---|---|---|---|
| 2024 | $5,610 | $74,178 | $9,377 | $64,801 |
| 2023 | $5,078 | $65,977 | $8,340 | $57,637 |
| 2022 | $5,078 | $60,198 | $7,610 | $52,588 |
| 2021 | $4,793 | $56,477 | $7,140 | $49,337 |
| 2020 | $4,831 | $55,369 | $7,000 | $48,369 |
| 2019 | $4,770 | $53,672 | $6,712 | $46,960 |
| 2018 | $5,136 | $51,116 | $6,392 | $44,724 |
| 2017 | $5,414 | $53,914 | $6,391 | $47,523 |
| 2016 | $5,078 | $46,665 | $6,391 | $40,274 |
| 2015 | $4,833 | $39,892 | $5,500 | $34,392 |
| 2014 | -- | $36,551 | $6,000 | $30,551 |
| 2013 | -- | $36,904 | $7,153 | $29,751 |
Source: Public Records
Map
Nearby Homes
- 18 W South St
- 215 W Rock St
- Lot 1 Blk 12 W John St
- 111 W North St
- 403 Corri Ln
- 302 N Center St
- 00 Lakewood Springs 7a
- Lot 6 Lakeside
- Lot 1B Lakeside Dr
- 604 W Lee St
- 13811 Hale Rd
- 405 Cooper St
- 209 Sweetbriar St
- 508 Ramsden Rd
- 3005 Courtney St
- 306 Waubonsee Dr
- 3304 Alyssa St Unit 2A
- 3119 Hoffman St
- 2813 Hoffman St
- 3407 Tamaira St