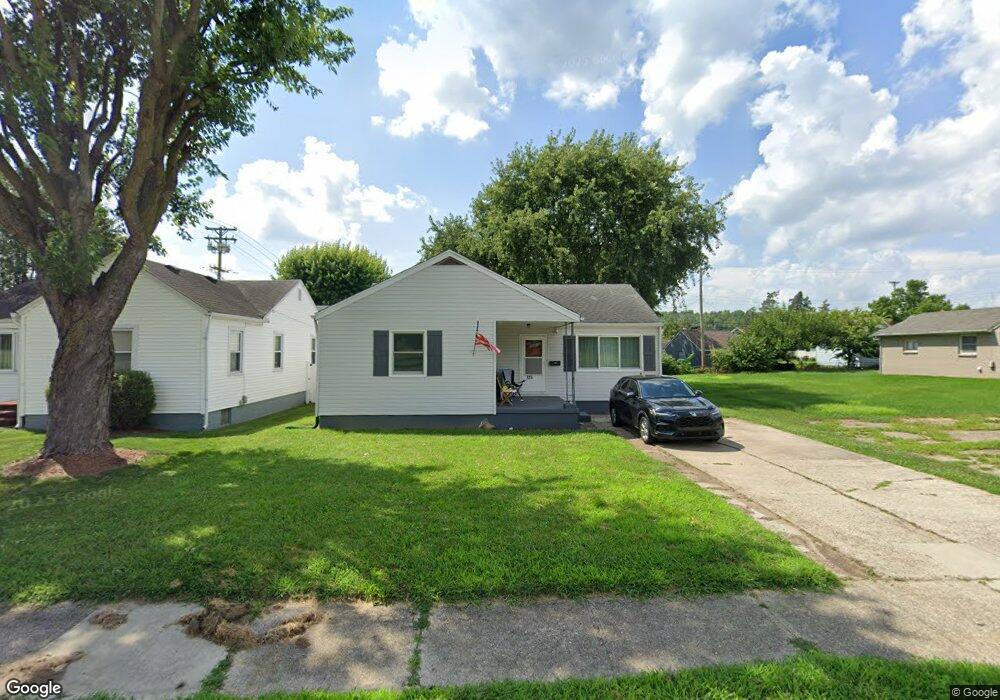
525 S Main St Miamisburg, OH 45342
Downtown Miamisburg NeighborhoodEstimated Value: $153,000 - $170,000
3
Beds
1
Bath
1,056
Sq Ft
$152/Sq Ft
Est. Value
About This Home
This home is located at 525 S Main St, Miamisburg, OH 45342 and is currently estimated at $160,862, approximately $152 per square foot. 525 S Main St is a home located in Montgomery County with nearby schools including Miamisburg High School and Bethel Baptist School.
Ownership History
Date
Name
Owned For
Owner Type
Purchase Details
Closed on
Nov 18, 2024
Sold by
Rentfolio Llc
Bought by
Lam Trinh Anh Thu and Putt Joe
Current Estimated Value
Home Financials for this Owner
Home Financials are based on the most recent Mortgage that was taken out on this home.
Original Mortgage
$150,100
Outstanding Balance
$148,661
Interest Rate
6.32%
Mortgage Type
New Conventional
Estimated Equity
$12,201
Purchase Details
Closed on
Apr 25, 2024
Sold by
Wooldridge Larry J
Bought by
Rentfolio Llc
Home Financials for this Owner
Home Financials are based on the most recent Mortgage that was taken out on this home.
Original Mortgage
$109,658
Interest Rate
6.82%
Mortgage Type
Construction
Purchase Details
Closed on
Feb 2, 2004
Sold by
Estate Of John Wooldridge Jr
Bought by
Wooldridge Lassie M
Create a Home Valuation Report for This Property
The Home Valuation Report is an in-depth analysis detailing your home's value as well as a comparison with similar homes in the area
Home Values in the Area
Average Home Value in this Area
Purchase History
| Date | Buyer | Sale Price | Title Company |
|---|---|---|---|
| Lam Trinh Anh Thu | $158,000 | None Listed On Document | |
| Lam Trinh Anh Thu | $158,000 | None Listed On Document | |
| Rentfolio Llc | $85,000 | National Title | |
| Rentfolio Llc | $85,000 | National Title | |
| Wooldridge Lassie M | -- | -- |
Source: Public Records
Mortgage History
| Date | Status | Borrower | Loan Amount |
|---|---|---|---|
| Open | Lam Trinh Anh Thu | $150,100 | |
| Closed | Lam Trinh Anh Thu | $150,100 | |
| Previous Owner | Rentfolio Llc | $109,658 |
Source: Public Records
Tax History Compared to Growth
Tax History
| Year | Tax Paid | Tax Assessment Tax Assessment Total Assessment is a certain percentage of the fair market value that is determined by local assessors to be the total taxable value of land and additions on the property. | Land | Improvement |
|---|---|---|---|---|
| 2024 | $2,494 | $32,350 | $6,160 | $26,190 |
| 2023 | $2,494 | $32,350 | $6,160 | $26,190 |
| 2022 | $2,147 | $22,470 | $4,280 | $18,190 |
| 2021 | $1,653 | $22,470 | $4,280 | $18,190 |
| 2020 | $1,689 | $22,470 | $4,280 | $18,190 |
| 2019 | $1,549 | $18,730 | $4,280 | $14,450 |
| 2018 | $1,554 | $18,730 | $4,280 | $14,450 |
| 2017 | $1,545 | $18,730 | $4,280 | $14,450 |
| 2016 | $1,575 | $18,440 | $4,280 | $14,160 |
| 2015 | $1,548 | $18,440 | $4,280 | $14,160 |
| 2014 | $1,548 | $18,440 | $4,280 | $14,160 |
| 2012 | -- | $21,700 | $6,240 | $15,460 |
Source: Public Records
Map
Nearby Homes