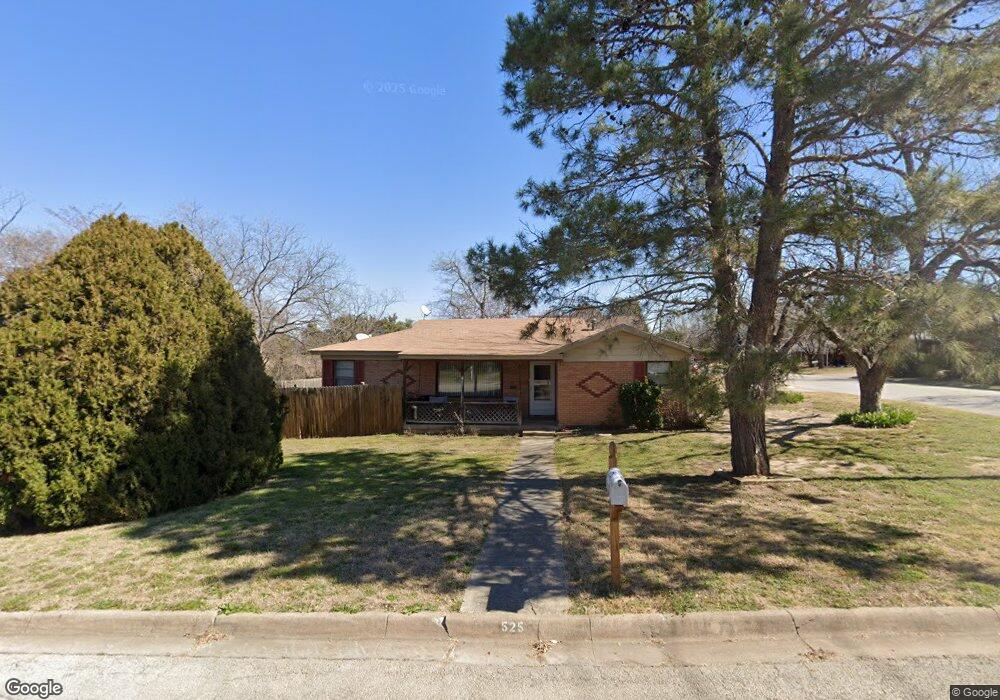
525 Sandell Dr Fort Worth, TX 76108
Estimated Value: $221,000 - $238,049
3
Beds
2
Baths
1,372
Sq Ft
$167/Sq Ft
Est. Value
About This Home
This home is located at 525 Sandell Dr, Fort Worth, TX 76108 and is currently estimated at $228,512, approximately $166 per square foot. 525 Sandell Dr is a home located in Tarrant County with nearby schools including Liberty Elementary School, Brewer Middle School, and Tannahill Intermediate School.
Ownership History
Date
Name
Owned For
Owner Type
Purchase Details
Closed on
Sep 20, 1999
Sold by
Hanstad Edward L and Hanstad Rebecca Denise
Bought by
Garza Benjamin R and Garza Joni L
Current Estimated Value
Home Financials for this Owner
Home Financials are based on the most recent Mortgage that was taken out on this home.
Original Mortgage
$63,240
Outstanding Balance
$19,267
Interest Rate
8.18%
Mortgage Type
VA
Estimated Equity
$209,245
Purchase Details
Closed on
Nov 29, 1994
Sold by
Brummett Darrell K and Brummett Sylvia M
Bought by
Hanstad Edward Lars and Hanstad Rebecca Denise
Home Financials for this Owner
Home Financials are based on the most recent Mortgage that was taken out on this home.
Original Mortgage
$31,000
Interest Rate
8.99%
Create a Home Valuation Report for This Property
The Home Valuation Report is an in-depth analysis detailing your home's value as well as a comparison with similar homes in the area
Home Values in the Area
Average Home Value in this Area
Purchase History
| Date | Buyer | Sale Price | Title Company |
|---|---|---|---|
| Garza Benjamin R | -- | Stewart Title | |
| Hanstad Edward Lars | -- | American Title Company |
Source: Public Records
Mortgage History
| Date | Status | Borrower | Loan Amount |
|---|---|---|---|
| Open | Garza Benjamin R | $63,240 | |
| Previous Owner | Hanstad Edward Lars | $31,000 |
Source: Public Records
Tax History Compared to Growth
Tax History
| Year | Tax Paid | Tax Assessment Tax Assessment Total Assessment is a certain percentage of the fair market value that is determined by local assessors to be the total taxable value of land and additions on the property. | Land | Improvement |
|---|---|---|---|---|
| 2025 | $2,417 | $220,629 | $51,370 | $169,259 |
| 2024 | $2,417 | $220,629 | $51,370 | $169,259 |
| 2023 | $3,634 | $232,000 | $51,370 | $180,630 |
| 2022 | $3,763 | $171,535 | $25,000 | $146,535 |
| 2021 | $3,474 | $156,294 | $25,000 | $131,294 |
| 2020 | $3,182 | $126,432 | $25,000 | $101,432 |
| 2019 | $3,003 | $123,546 | $25,000 | $98,546 |
| 2018 | $2,205 | $94,900 | $12,000 | $82,900 |
| 2017 | $2,521 | $90,654 | $12,000 | $78,654 |
| 2016 | $2,292 | $87,058 | $12,000 | $75,058 |
| 2015 | $1,718 | $71,300 | $10,000 | $61,300 |
| 2014 | $1,718 | $71,300 | $10,000 | $61,300 |
Source: Public Records
Map
Nearby Homes
- 537 June Dr
- 501 Odie Dr
- 730 S Cherry Ln
- 801 Ala Dr
- 633 Kimbrough St
- 149 Wilson Cliff Dr
- 321 Meadow Park Dr
- 852 Odie Dr
- 8017 White Settlement Rd
- 8203 Delmar St
- 867 Odie Dr
- 8232 Redonda St
- 7836 Corina Dr
- 7805 Whitney Dr
- 872 June Dr
- 8316 Sussex St
- 301 Mirike Dr
- 9752 New Bern Dr
- 809 Mirike Dr
- 200 Waynell St
- 521 Sandell Dr
- 524 Crandle Dr
- 528 Crandle Dr
- 517 Sandell Dr
- 7991 Wyatt Dr
- 520 Crandle Dr
- 524 Sandell Dr
- 3012 Plumbago Dr
- 11024 Cacao Dr
- 11020 Cacao Dr
- 11028 Cacao Dr
- 11012 Cacao Dr
- 11032 Cacao Dr
- 3016 Plumbago Dr
- 513 Sandell Dr
- 516 Crandle Dr
- 8001 Wyatt Dr
- 516 Sandell Dr
- 7985 Wyatt Dr
- 512 Crandle Dr