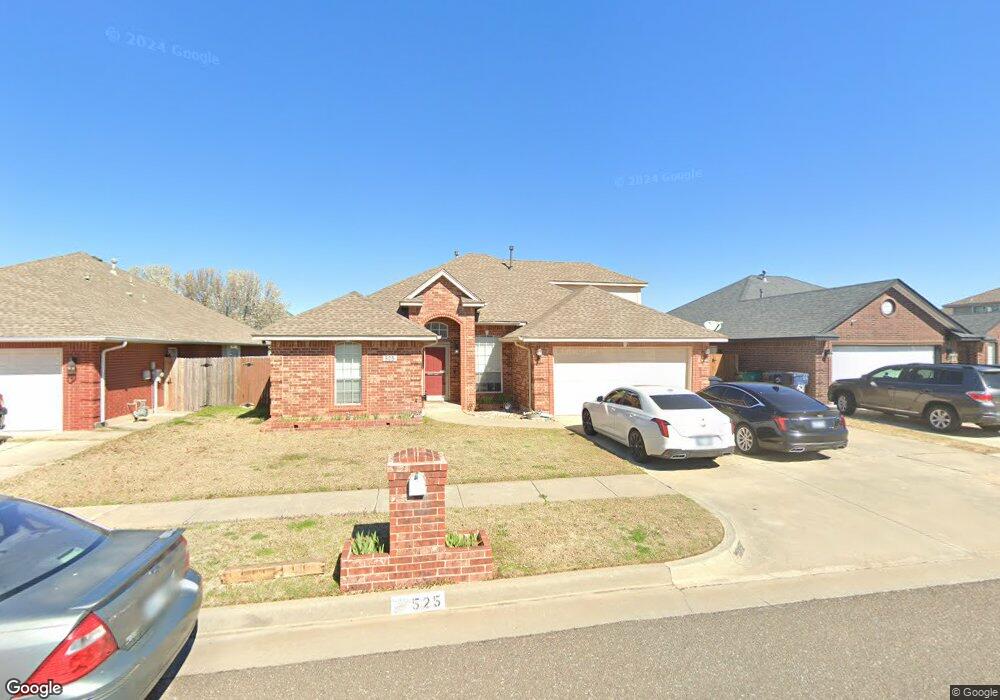
525 SW 155th Ct Oklahoma City, OK 73170
Stone Meadows NeighborhoodEstimated Value: $272,212 - $280,000
4
Beds
2
Baths
1,921
Sq Ft
$143/Sq Ft
Est. Value
About This Home
This home is located at 525 SW 155th Ct, Oklahoma City, OK 73170 and is currently estimated at $275,303, approximately $143 per square foot. 525 SW 155th Ct is a home located in Cleveland County with nearby schools including Briarwood Elementary School, Southmoore High School, and Redbud Farm and Christian School.
Ownership History
Date
Name
Owned For
Owner Type
Purchase Details
Closed on
Oct 24, 2008
Sold by
Blumenthal John
Bought by
Willis Eddie and Willis Laura
Current Estimated Value
Home Financials for this Owner
Home Financials are based on the most recent Mortgage that was taken out on this home.
Original Mortgage
$158,508
Outstanding Balance
$102,755
Interest Rate
5.83%
Mortgage Type
FHA
Estimated Equity
$172,548
Purchase Details
Closed on
Oct 9, 2008
Sold by
Blumenthal Carrie
Bought by
Blumenthal John
Home Financials for this Owner
Home Financials are based on the most recent Mortgage that was taken out on this home.
Original Mortgage
$158,508
Outstanding Balance
$102,755
Interest Rate
5.83%
Mortgage Type
FHA
Estimated Equity
$172,548
Purchase Details
Closed on
Jul 30, 2007
Sold by
Blumenthal Carrie
Bought by
Blumenthal John
Purchase Details
Closed on
Nov 1, 2002
Sold by
Family Living Homebuilders, Llc
Bought by
Baker Carrie
Purchase Details
Closed on
Jan 30, 2002
Sold by
Stone, O L Inc
Bought by
Family Living Homebuilders, Llc
Create a Home Valuation Report for This Property
The Home Valuation Report is an in-depth analysis detailing your home's value as well as a comparison with similar homes in the area
Home Values in the Area
Average Home Value in this Area
Purchase History
| Date | Buyer | Sale Price | Title Company |
|---|---|---|---|
| Willis Eddie | $161,000 | The Oklahoma City Abstract & | |
| Blumenthal John | -- | The Oklahoma City Abstract & | |
| Blumenthal John | -- | None Available | |
| Baker Carrie | $141,000 | -- | |
| Family Living Homebuilders, Llc | $170,000 | -- |
Source: Public Records
Mortgage History
| Date | Status | Borrower | Loan Amount |
|---|---|---|---|
| Open | Willis Eddie | $158,508 |
Source: Public Records
Tax History Compared to Growth
Tax History
| Year | Tax Paid | Tax Assessment Tax Assessment Total Assessment is a certain percentage of the fair market value that is determined by local assessors to be the total taxable value of land and additions on the property. | Land | Improvement |
|---|---|---|---|---|
| 2024 | $2,391 | $20,646 | $4,424 | $16,222 |
| 2023 | $2,328 | $20,045 | $3,032 | $17,013 |
| 2022 | $2,286 | $19,461 | $3,245 | $16,216 |
| 2021 | $2,212 | $18,894 | $2,400 | $16,494 |
| 2020 | $2,221 | $18,894 | $2,400 | $16,494 |
| 2019 | $2,246 | $18,894 | $2,400 | $16,494 |
| 2018 | $2,271 | $18,895 | $2,400 | $16,495 |
| 2017 | $2,273 | $18,895 | $0 | $0 |
| 2016 | $2,272 | $18,705 | $2,376 | $16,329 |
| 2015 | $2,035 | $18,160 | $2,292 | $15,868 |
| 2014 | $2,006 | $17,632 | $1,560 | $16,072 |
Source: Public Records
Map
Nearby Homes
- 2401 Lakecrest Dr
- 1606 Westmore Dr
- 624 SW 153rd St
- 716 SW 154th Place
- 720 SW 153rd St
- 1513 SW 23rd St
- 15209 Megan Cir
- 2123 Parkview Dr
- 500 SW 159th Terrace
- 15500 Sandstone Terrace
- 15600 Sandstone Terrace
- 2101 Westmore Dr
- 15113 Stone Meadows Dr
- 1402 SW 25th St
- 716 SW 149th Place
- 1312 SW 25th St
- 2110 Lonnie Ln
- 813 SW 151st St Unit A&B
- 809 SW 161st St
- 2142 Goodrich Dr
- 529 SW 155th Ct
- 521 SW 155th Ct
- 524 SW 154th Ct
- 533 SW 155th Ct
- 528 SW 154th Ct
- 517 SW 155th Ct
- 520 SW 154th Ct
- 532 SW 154th Ct
- 516 SW 154th Ct
- 524 SW 155th Ct
- 528 SW 155th Ct
- 520 SW 155th Ct
- 513 SW 155th Ct
- 537 SW 155th Ct
- 532 SW 155th Ct
- 512 SW 154th Ct
- 536 SW 154th Ct
- 516 SW 155th Ct
- 541 SW 155th Ct
- 509 SW 155th Ct