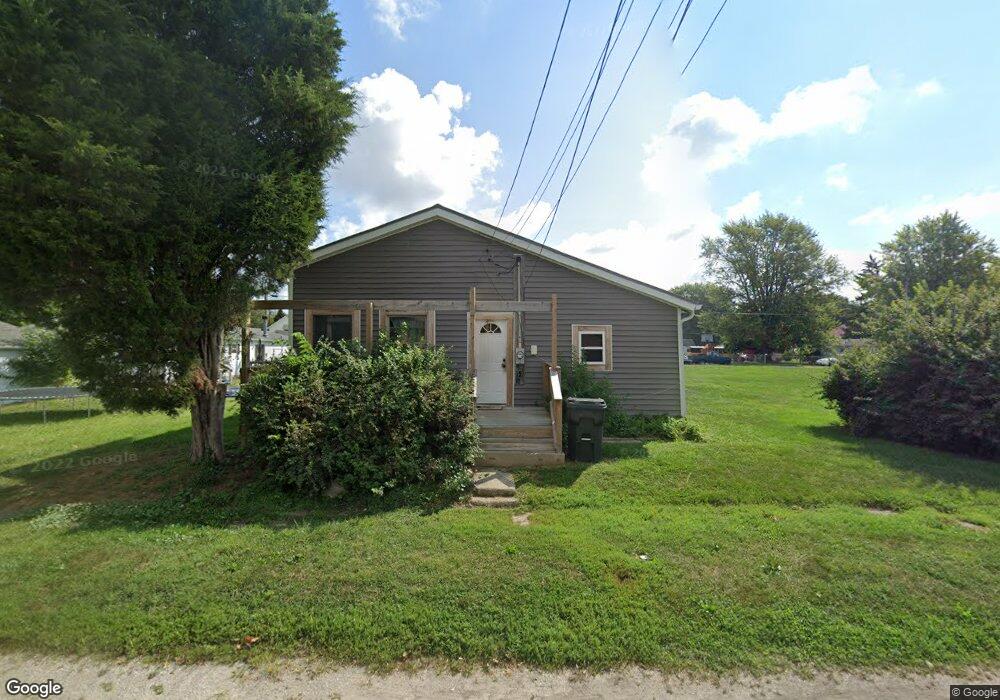
525 Swan St Huntington, IN 46750
Estimated Value: $81,000 - $96,187
2
Beds
1
Bath
928
Sq Ft
$94/Sq Ft
Est. Value
About This Home
This home is located at 525 Swan St, Huntington, IN 46750 and is currently estimated at $87,297, approximately $94 per square foot. 525 Swan St is a home located in Huntington County with nearby schools including Lincoln Elementary School, Crestview Middle School, and Huntington North High School.
Ownership History
Date
Name
Owned For
Owner Type
Purchase Details
Closed on
Jun 28, 2024
Sold by
Williams Brenda K
Bought by
Vorhees Christopher Demetri
Current Estimated Value
Home Financials for this Owner
Home Financials are based on the most recent Mortgage that was taken out on this home.
Original Mortgage
$60,325
Outstanding Balance
$59,609
Interest Rate
7.02%
Mortgage Type
New Conventional
Estimated Equity
$27,688
Purchase Details
Closed on
Jul 17, 2020
Sold by
Shoemaker Brook N
Bought by
Williams Brenda K
Create a Home Valuation Report for This Property
The Home Valuation Report is an in-depth analysis detailing your home's value as well as a comparison with similar homes in the area
Home Values in the Area
Average Home Value in this Area
Purchase History
| Date | Buyer | Sale Price | Title Company |
|---|---|---|---|
| Vorhees Christopher Demetri | $63,500 | Fidelity National Title | |
| Williams Brenda K | -- | -- | |
| Shoemaker Brook N | -- | None Available |
Source: Public Records
Mortgage History
| Date | Status | Borrower | Loan Amount |
|---|---|---|---|
| Open | Vorhees Christopher Demetri | $60,325 |
Source: Public Records
Tax History Compared to Growth
Tax History
| Year | Tax Paid | Tax Assessment Tax Assessment Total Assessment is a certain percentage of the fair market value that is determined by local assessors to be the total taxable value of land and additions on the property. | Land | Improvement |
|---|---|---|---|---|
| 2024 | $672 | $66,600 | $8,400 | $58,200 |
| 2023 | $1,335 | $66,600 | $8,400 | $58,200 |
| 2022 | $1,195 | $59,600 | $8,400 | $51,200 |
| 2021 | $1,035 | $51,600 | $6,600 | $45,000 |
| 2020 | $502 | $49,600 | $6,600 | $43,000 |
| 2019 | $438 | $43,200 | $6,600 | $36,600 |
| 2018 | $438 | $43,200 | $6,600 | $36,600 |
| 2017 | $434 | $42,800 | $6,600 | $36,200 |
| 2016 | $409 | $42,400 | $6,600 | $35,800 |
| 2014 | $376 | $41,500 | $6,600 | $34,900 |
| 2013 | $376 | $42,300 | $6,600 | $35,700 |
Source: Public Records
Map
Nearby Homes