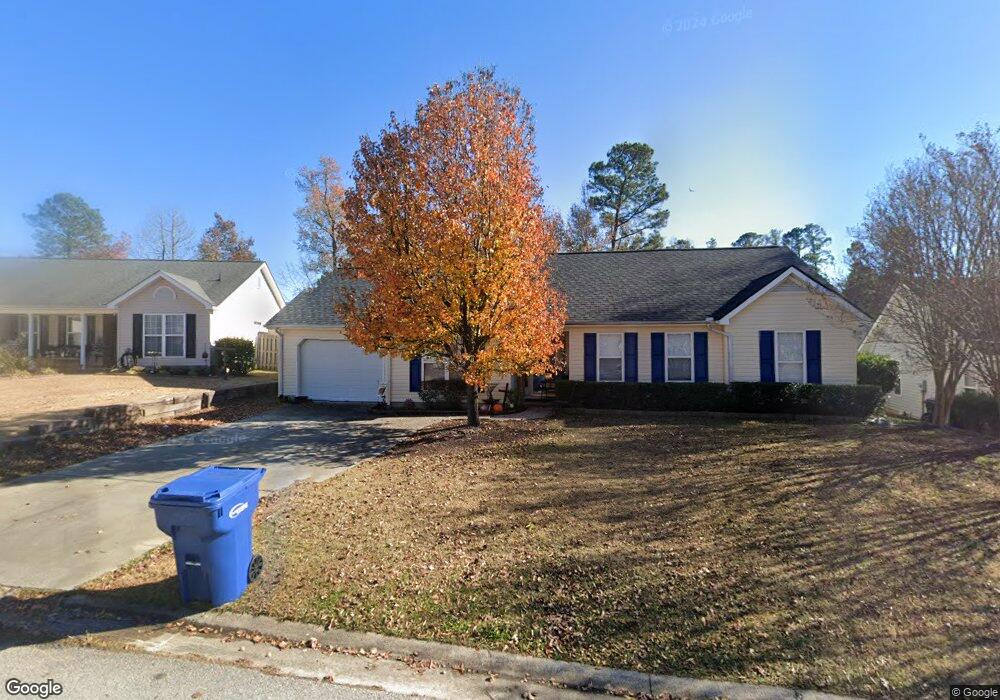
525 Wendover Way Grovetown, GA 30813
Estimated Value: $250,000 - $270,000
3
Beds
2
Baths
1,584
Sq Ft
$165/Sq Ft
Est. Value
About This Home
This home is located at 525 Wendover Way, Grovetown, GA 30813 and is currently estimated at $262,110, approximately $165 per square foot. 525 Wendover Way is a home located in Columbia County with nearby schools including Lewiston Elementary School, Evans High School, and Community Christian Academy.
Ownership History
Date
Name
Owned For
Owner Type
Purchase Details
Closed on
Jun 24, 2024
Sold by
Grover Tiffany Lynn
Bought by
Grover Steven and Grover Tiffany L
Current Estimated Value
Home Financials for this Owner
Home Financials are based on the most recent Mortgage that was taken out on this home.
Original Mortgage
$50,000
Outstanding Balance
$49,352
Interest Rate
6.94%
Mortgage Type
New Conventional
Estimated Equity
$212,758
Purchase Details
Closed on
Apr 23, 2003
Sold by
Grover Tiffany L
Bought by
Pierpont Shannon H and Pierpont Shannon L H
Home Financials for this Owner
Home Financials are based on the most recent Mortgage that was taken out on this home.
Original Mortgage
$103,975
Interest Rate
5.86%
Mortgage Type
Purchase Money Mortgage
Purchase Details
Closed on
May 16, 2002
Sold by
Nordahl Homes Inc
Bought by
Pierpont Shannon L H
Home Financials for this Owner
Home Financials are based on the most recent Mortgage that was taken out on this home.
Original Mortgage
$101,600
Interest Rate
6.98%
Create a Home Valuation Report for This Property
The Home Valuation Report is an in-depth analysis detailing your home's value as well as a comparison with similar homes in the area
Home Values in the Area
Average Home Value in this Area
Purchase History
| Date | Buyer | Sale Price | Title Company |
|---|---|---|---|
| Grover Steven | -- | -- | |
| Pierpont Shannon H | -- | -- | |
| Pierpont Shannon L H | $112,900 | -- |
Source: Public Records
Mortgage History
| Date | Status | Borrower | Loan Amount |
|---|---|---|---|
| Open | Grover Steven | $50,000 | |
| Previous Owner | Pierpont Shannon H | $103,975 | |
| Previous Owner | Pierpont Shannon L H | $101,600 |
Source: Public Records
Tax History Compared to Growth
Tax History
| Year | Tax Paid | Tax Assessment Tax Assessment Total Assessment is a certain percentage of the fair market value that is determined by local assessors to be the total taxable value of land and additions on the property. | Land | Improvement |
|---|---|---|---|---|
| 2025 | $2,472 | $101,212 | $17,604 | $83,608 |
| 2024 | $2,587 | $101,192 | $17,004 | $84,188 |
| 2023 | $2,587 | $96,178 | $15,904 | $80,274 |
| 2022 | $2,121 | $79,383 | $12,604 | $66,779 |
| 2021 | $899 | $70,867 | $11,704 | $59,163 |
| 2020 | $785 | $66,136 | $10,804 | $55,332 |
| 2019 | $672 | $62,062 | $10,304 | $51,758 |
| 2018 | $578 | $58,616 | $10,504 | $48,112 |
| 2017 | $587 | $58,849 | $9,904 | $48,945 |
| 2016 | $409 | $52,970 | $8,580 | $44,390 |
| 2015 | $459 | $54,711 | $8,980 | $45,731 |
| 2014 | $1,484 | $54,099 | $8,980 | $45,119 |
Source: Public Records
Map
Nearby Homes
- 522 Wendover Way
- 4660 Clifden Ave
- Ridgeway II Plan at Crawford Creek
- Hemingway Plan at Crawford Creek
- Essington II Plan at Crawford Creek
- Hampton II Plan at Crawford Creek
- Parkwood Plan at Crawford Creek
- Glendale Plan at Crawford Creek
- Dublin II Plan at Crawford Creek
- Bradford Plan at Crawford Creek
- Lincoln Plan at Crawford Creek
- Dublin Plan at Crawford Creek
- Townsend II Plan at Crawford Creek
- Fairport II Plan at Crawford Creek
- Maplewood Plan at Crawford Creek
- Galloway Plan at Crawford Creek
- Nottaway Plan at Crawford Creek
- Bradford II Plan at Crawford Creek
- Winter Park Plan at Crawford Creek
- Mill Creek Plan at Crawford Creek
- 523 Wendover Way
- 527 Wendover Way
- 4679 Clifden Ave
- 4677 Clifden Ave
- 519 Wendover Way
- 4675 Clifden Ave
- 4695 Clifden Ave
- 4673 Clifden Ave
- 520 Wendover Way
- 524 Wendover Way
- 4713 Durham Rd
- 518 Wendover Way
- 612 Clifden Ct
- 4711 Durham Rd
- 515 Wendover Way
- 4671 Clifden Ave
- 526 Wendover Way
- 4709 Durham Rd
- 516 Wendover Way
- 614 Clifden Ct