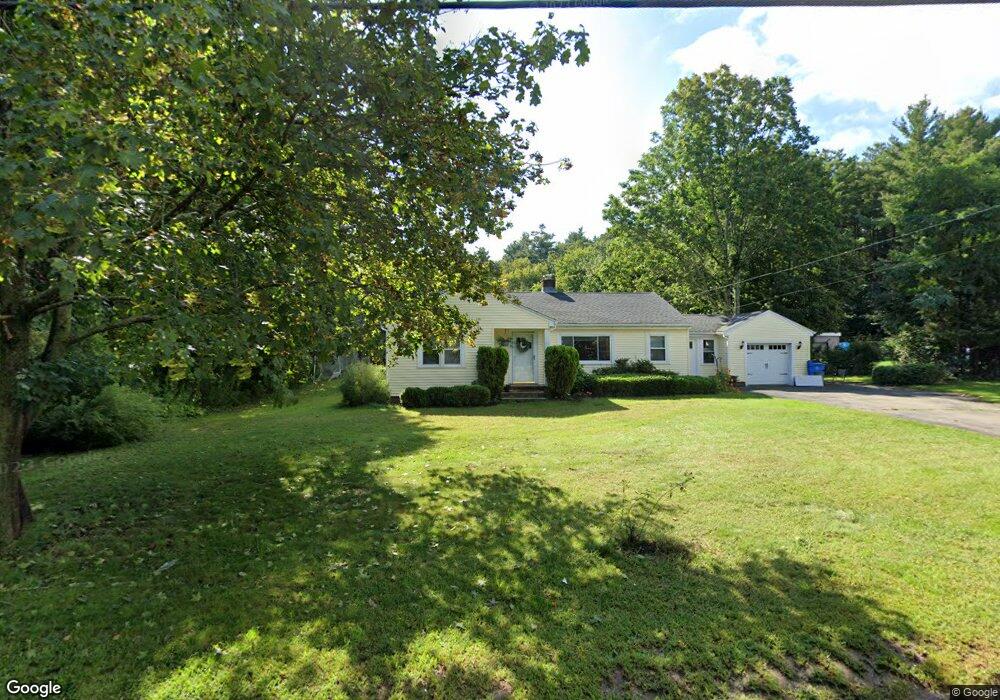
525 West St Wrentham, MA 02093
Sheldonville NeighborhoodEstimated Value: $467,000 - $569,255
3
Beds
1
Bath
1,231
Sq Ft
$419/Sq Ft
Est. Value
About This Home
This home is located at 525 West St, Wrentham, MA 02093 and is currently estimated at $516,064, approximately $419 per square foot. 525 West St is a home located in Norfolk County with nearby schools including Delaney Elementary School, Charles E Roderick, and Mercymount Country Day School.
Ownership History
Date
Name
Owned For
Owner Type
Purchase Details
Closed on
Nov 5, 2008
Sold by
Structured Asset Sec C
Bought by
Mckay James T and Destefano Jennifer N
Current Estimated Value
Home Financials for this Owner
Home Financials are based on the most recent Mortgage that was taken out on this home.
Original Mortgage
$238,551
Outstanding Balance
$156,591
Interest Rate
6.08%
Mortgage Type
Purchase Money Mortgage
Estimated Equity
$359,473
Purchase Details
Closed on
Jun 19, 2008
Sold by
Godfrey Albert A and Wells Fargo Bk
Bought by
Wells Fargo Bk
Purchase Details
Closed on
Sep 29, 1999
Sold by
Werning Charles L and Werning Marilyn L
Bought by
Godfrey Albert A and Godfrey Deborah R
Home Financials for this Owner
Home Financials are based on the most recent Mortgage that was taken out on this home.
Original Mortgage
$135,000
Interest Rate
7.85%
Mortgage Type
Purchase Money Mortgage
Purchase Details
Closed on
Nov 30, 1994
Sold by
Cannon Michael H and Cannon Helen M
Bought by
Werning Charles L and Werning Marilyn L
Create a Home Valuation Report for This Property
The Home Valuation Report is an in-depth analysis detailing your home's value as well as a comparison with similar homes in the area
Home Values in the Area
Average Home Value in this Area
Purchase History
| Date | Buyer | Sale Price | Title Company |
|---|---|---|---|
| Mckay James T | $241,700 | -- | |
| Structured Asset Sec C | -- | -- | |
| Wells Fargo Bk | $175,000 | -- | |
| Godfrey Albert A | $195,000 | -- | |
| Werning Charles L | $132,000 | -- |
Source: Public Records
Mortgage History
| Date | Status | Borrower | Loan Amount |
|---|---|---|---|
| Open | Mckay James T | $238,551 | |
| Previous Owner | Werning Charles L | $160,000 | |
| Previous Owner | Werning Charles L | $135,000 |
Source: Public Records
Tax History Compared to Growth
Tax History
| Year | Tax Paid | Tax Assessment Tax Assessment Total Assessment is a certain percentage of the fair market value that is determined by local assessors to be the total taxable value of land and additions on the property. | Land | Improvement |
|---|---|---|---|---|
| 2025 | $5,395 | $465,500 | $240,400 | $225,100 |
| 2024 | $4,970 | $414,200 | $240,400 | $173,800 |
| 2023 | $4,715 | $373,600 | $218,500 | $155,100 |
| 2022 | $4,857 | $355,300 | $212,500 | $142,800 |
| 2021 | $4,706 | $334,500 | $198,600 | $135,900 |
| 2020 | $4,060 | $284,900 | $151,600 | $133,300 |
| 2019 | $3,776 | $267,400 | $136,400 | $131,000 |
| 2018 | $3,974 | $279,100 | $136,500 | $142,600 |
| 2017 | $3,724 | $261,300 | $133,800 | $127,500 |
| 2016 | $3,666 | $256,700 | $130,000 | $126,700 |
| 2015 | $3,682 | $245,800 | $138,800 | $107,000 |
| 2014 | $3,621 | $236,500 | $133,500 | $103,000 |
Source: Public Records
Map
Nearby Homes
- 50 Green St
- 80 Carriage House Ln
- 440 Chestnut St
- 1204 South St
- 1222 South St
- 19 Chestnut Lot 0
- 791 South St Unit 5
- 955 Summer St
- 11 Amber Dr
- 4 Munroe Dr
- 12 Grant St
- Lot 1 - Blueberry 2 Car Plan at King Philip Estates
- Lot 8 - Blueberry 2 Car Plan at King Philip Estates
- Lot 5 - Hughes 2 car Plan at King Philip Estates
- Lot 6 - Blueberry 3 Car Plan at King Philip Estates
- Lot 2 - Camden 2 Car Plan at King Philip Estates
- Lot 7 - Cedar Plan at King Philip Estates
- Lot 4 - Hemingway 2 Car Plan at King Philip Estates
- Lot 3 - Blueberry 2 Car Plan at King Philip Estates
- 387 South St