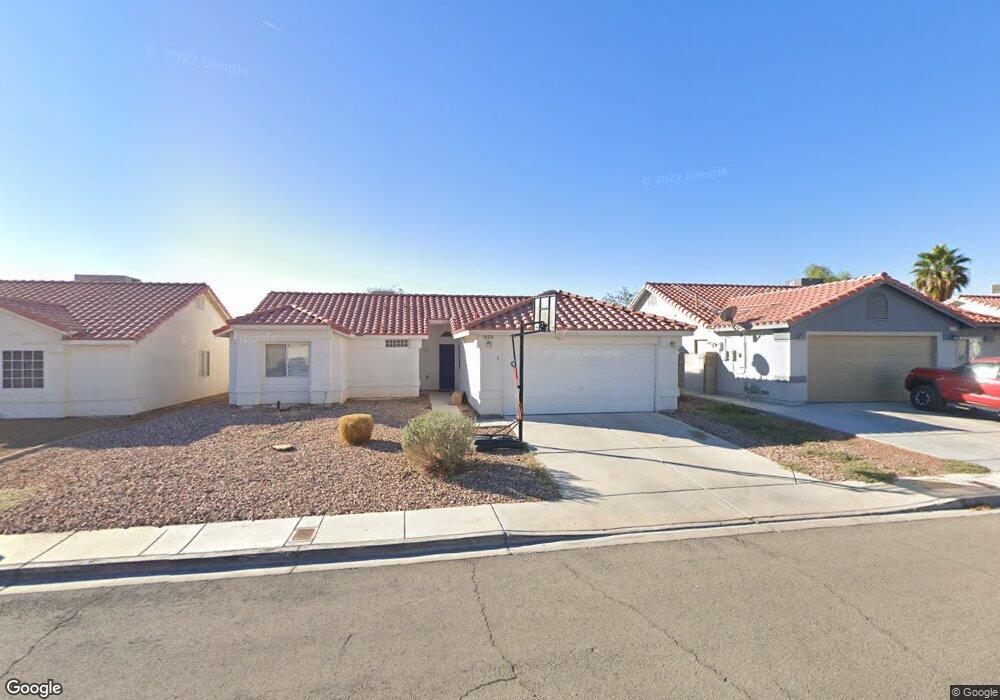
525 Willowick Ave Unit none North Las Vegas, NV 89031
Craig Ranch NeighborhoodEstimated Value: $226,000 - $397,000
3
Beds
2
Baths
1,253
Sq Ft
$268/Sq Ft
Est. Value
About This Home
This home is located at 525 Willowick Ave Unit none, North Las Vegas, NV 89031 and is currently estimated at $335,363, approximately $267 per square foot. 525 Willowick Ave Unit none is a home located in Clark County with nearby schools including Fredric W. Watson Elementary School, Clifford O. Findlay Middle School, and Legacy High School.
Ownership History
Date
Name
Owned For
Owner Type
Purchase Details
Closed on
Oct 24, 2018
Sold by
2018 4 Ih Borrower Lp
Bought by
2018 4 Ih Borrower Lp
Current Estimated Value
Home Financials for this Owner
Home Financials are based on the most recent Mortgage that was taken out on this home.
Original Mortgage
$960,304,000
Outstanding Balance
$842,811,850
Interest Rate
4.9%
Mortgage Type
Commercial
Estimated Equity
-$842,476,487
Purchase Details
Closed on
Dec 11, 2012
Sold by
The Willowick Series Of The Remar Real E
Bought by
Colfin Ai Nv 2 Llc
Purchase Details
Closed on
Aug 8, 2007
Sold by
Harrison Reid Martin and Harrison Marleen Renee
Bought by
Willowick Series Of The Remar Real Estat
Purchase Details
Closed on
Feb 9, 1995
Sold by
Trop Rev
Bought by
Harrison Reid M
Home Financials for this Owner
Home Financials are based on the most recent Mortgage that was taken out on this home.
Original Mortgage
$103,900
Interest Rate
9.27%
Create a Home Valuation Report for This Property
The Home Valuation Report is an in-depth analysis detailing your home's value as well as a comparison with similar homes in the area
Home Values in the Area
Average Home Value in this Area
Purchase History
| Date | Buyer | Sale Price | Title Company |
|---|---|---|---|
| 2018 4 Ih Borrower Lp | -- | Os National Llc | |
| Colfin Ai Nv 2 Llc | $66,500 | Lawyers Title Of Nevada Cha | |
| Willowick Series Of The Remar Real Estat | -- | None Available | |
| Harrison Reid M | $96,000 | Fidelity National Title |
Source: Public Records
Mortgage History
| Date | Status | Borrower | Loan Amount |
|---|---|---|---|
| Open | 2018 4 Ih Borrower Lp | $960,304,000 | |
| Previous Owner | Harrison Reid M | $103,900 |
Source: Public Records
Tax History Compared to Growth
Tax History
| Year | Tax Paid | Tax Assessment Tax Assessment Total Assessment is a certain percentage of the fair market value that is determined by local assessors to be the total taxable value of land and additions on the property. | Land | Improvement |
|---|---|---|---|---|
| 2025 | $1,476 | $87,038 | $29,750 | $57,288 |
| 2024 | $1,367 | $87,038 | $29,750 | $57,288 |
| 2023 | $954 | $83,646 | $29,400 | $54,246 |
| 2022 | $1,327 | $74,161 | $24,150 | $50,011 |
| 2021 | $1,229 | $68,620 | $21,000 | $47,620 |
| 2020 | $1,139 | $67,677 | $20,300 | $47,377 |
| 2019 | $1,067 | $64,993 | $18,200 | $46,793 |
| 2018 | $1,018 | $59,321 | $14,000 | $45,321 |
| 2017 | $1,881 | $56,081 | $12,250 | $43,831 |
| 2016 | $954 | $47,087 | $8,750 | $38,337 |
| 2015 | $951 | $36,724 | $7,000 | $29,724 |
| 2014 | $922 | $26,656 | $5,600 | $21,056 |
Source: Public Records
Map
Nearby Homes
- 525 Bright Lights Ave
- 5741 Copper Sun Ct
- 627 Stonehurst Dr
- 729 Turtleback Dr
- 5737 Royal Sands St
- 351 Caneflower Ct
- 901 Sage Hollow Cir
- 5837 Gold Horizon St
- 221 Mountain Cedar Ct
- 5637 Vermillion Ridge St
- 623 Dry Valley Ave
- 635 Dry Valley Ave
- 5523 Jose Leon St
- 129 Pivot Ave
- 210 Red Sandstone Ave
- 654 Roberta Alecia Ave
- 6119 Magic Mesa St
- 5912 Hollowridge Rd
- 138 Red Sandstone Ave
- 449 Orchid Oasis Ave
- 525 Willowick Ave
- 529 Willowick Ave
- 521 Willowick Ave
- 520 Bright Lights Ave
- 517 Willowick Ave
- 524 Bright Lights Ave
- 601 Willowick Ave
- 516 Bright Lights Ave
- 526 Willowick Ave
- 522 Willowick Ave
- 528 Bright Lights Ave
- 512 Bright Lights Ave
- 530 Willowick Ave
- 518 Willowick Ave
- 513 Willowick Ave
- 605 Willowick Ave
- 532 Bright Lights Ave
- 508 Bright Lights Ave
- 602 Willowick Ave
- 514 Willowick Ave