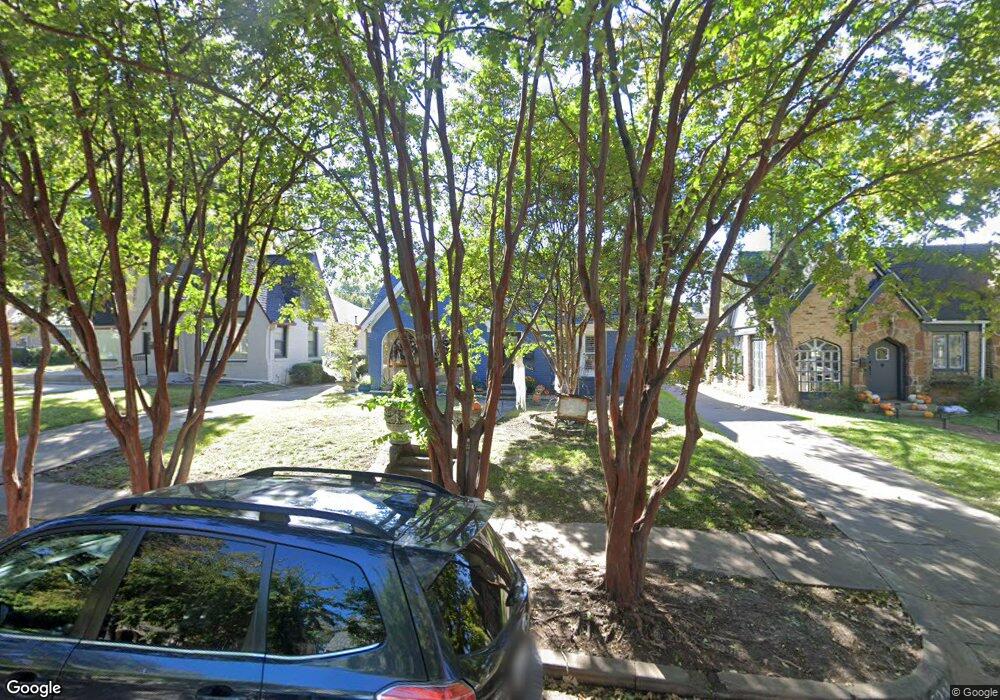
5250 Monticello Ave Dallas, TX 75206
Lower Greenville NeighborhoodEstimated Value: $829,000 - $1,177,000
3
Beds
2
Baths
1,708
Sq Ft
$599/Sq Ft
Est. Value
About This Home
This home is located at 5250 Monticello Ave, Dallas, TX 75206 and is currently estimated at $1,023,798, approximately $599 per square foot. 5250 Monticello Ave is a home located in Dallas County with nearby schools including Mockingbird Elementary School, J L Long Middle School, and Woodrow Wilson High School.
Ownership History
Date
Name
Owned For
Owner Type
Purchase Details
Closed on
May 3, 2016
Sold by
Wilson Greg and Wilson Patricia
Bought by
Matthew Stanley M and Mathew Kavitha
Current Estimated Value
Home Financials for this Owner
Home Financials are based on the most recent Mortgage that was taken out on this home.
Original Mortgage
$348,500
Outstanding Balance
$277,881
Interest Rate
3.71%
Mortgage Type
New Conventional
Estimated Equity
$745,917
Purchase Details
Closed on
Mar 5, 2001
Sold by
Moody Robert G and Moody Linda A
Bought by
Wilson Greg and Wilson Patricia
Home Financials for this Owner
Home Financials are based on the most recent Mortgage that was taken out on this home.
Original Mortgage
$221,600
Interest Rate
7.19%
Purchase Details
Closed on
Nov 26, 1996
Sold by
Lind Georgia J
Bought by
Moody Robert G and Moody Linda A
Home Financials for this Owner
Home Financials are based on the most recent Mortgage that was taken out on this home.
Original Mortgage
$154,628
Interest Rate
7.85%
Mortgage Type
VA
Create a Home Valuation Report for This Property
The Home Valuation Report is an in-depth analysis detailing your home's value as well as a comparison with similar homes in the area
Home Values in the Area
Average Home Value in this Area
Purchase History
| Date | Buyer | Sale Price | Title Company |
|---|---|---|---|
| Matthew Stanley M | -- | Chicago Title | |
| Wilson Greg | -- | -- | |
| Moody Robert G | -- | -- |
Source: Public Records
Mortgage History
| Date | Status | Borrower | Loan Amount |
|---|---|---|---|
| Open | Matthew Stanley M | $348,500 | |
| Previous Owner | Wilson Greg | $221,600 | |
| Previous Owner | Moody Robert G | $154,628 | |
| Closed | Wilson Greg | $55,400 |
Source: Public Records
Tax History Compared to Growth
Tax History
| Year | Tax Paid | Tax Assessment Tax Assessment Total Assessment is a certain percentage of the fair market value that is determined by local assessors to be the total taxable value of land and additions on the property. | Land | Improvement |
|---|---|---|---|---|
| 2025 | $11,874 | $1,317,240 | $344,380 | $972,860 |
| 2024 | $11,874 | $727,980 | $344,380 | $383,600 |
| 2023 | $11,874 | $705,430 | $344,380 | $361,050 |
| 2022 | $15,509 | $620,250 | $309,940 | $310,310 |
| 2021 | $13,513 | $512,260 | $275,500 | $236,760 |
| 2020 | $13,897 | $512,260 | $275,500 | $236,760 |
| 2019 | $14,575 | $512,260 | $275,500 | $236,760 |
| 2018 | $12,644 | $465,000 | $241,060 | $223,940 |
| 2017 | $11,382 | $418,570 | $206,630 | $211,940 |
| 2016 | $11,382 | $418,570 | $206,630 | $211,940 |
| 2015 | $10,474 | $381,860 | $154,970 | $226,890 |
| 2014 | $10,474 | $381,860 | $154,970 | $226,890 |
Source: Public Records
Map
Nearby Homes
- 5242 Merrimac Ave
- 5206 Monticello Ave
- 5419 Vanderbilt Ave
- 5407 Merrimac Ave
- 5230 Vickery Blvd
- 5422 Morningside Ave
- 5135 Vickery Blvd Unit A
- 5322 Miller Ave
- 5200 Longview St
- 5447 Morningside Ave
- 5200 Martel Ave Unit 37C
- 5200 Martel Ave Unit 23B
- 5200 Martel Ave Unit 11A
- 5200 Martel Ave Unit 16C
- 5200 Martel Ave Unit 35C
- 5200 Martel Ave Unit 27B
- 5200 Martel Ave Unit 6Q
- 5200 Martel Ave Unit 32B
- 5200 Martel Ave Unit 36A
- 5016 Vickery Blvd
- 5252 Monticello Ave
- 5242 Monticello Ave
- 5238 Monticello Ave
- 5302 Monticello Ave
- 5251 Ridgedale Ave
- 5247 Ridgedale Ave
- 5255 Ridgedale Ave
- 5243 Ridgedale Ave
- 5251 Monticello Ave
- 5247 Monticello Ave
- 5234 Monticello Ave
- 5253 Monticello Ave
- 5306 Monticello Ave
- 5239 Ridgedale Ave
- 5243 Monticello Ave
- 5303 Ridgedale Ave
- 5301 Monticello Ave
- 5239 Monticello Ave
- 5230 Monticello Ave
- 5235 Ridgedale Ave