


5250 Nash Creek Rd Kingsbury, TX 78638
Estimated payment $489/month
About This Lot
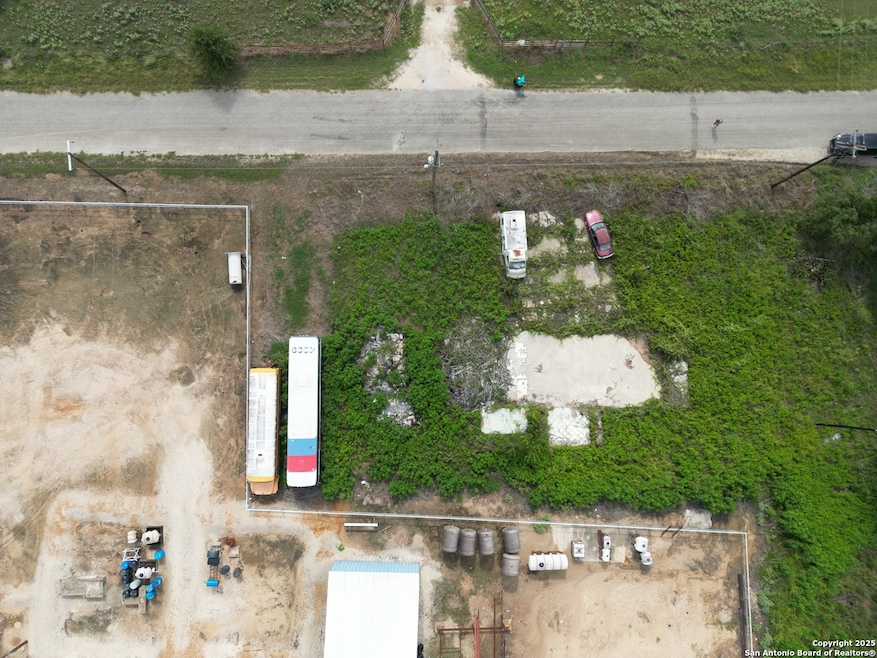
Commercial and/or Residential potential. Just less than 1 acre with road frontage convenient to FM 1150, then to Hwy. 90, 90A or Interstate 10. This property has a 1500 sqft cement slab on the property from a previous structure. There is a nice east view from the center of the property. New GVEC electric on the property.

Property Details
Property Type
- Land
Est. Annual Taxes
- $1,084
Lot Details
- 0.8 Acre Lot
- Property is zoned RURAL
Home Design
- 34,848 Sq Ft Home
Community Details
- Rural Acres Subdivision
Listing and Financial Details
- Assessor Parcel Number 2G0014000010900000
Map
Home Values in the Area
Average Home Value in this Area
Tax History
| Year | Tax Paid | Tax Assessment Tax Assessment Total Assessment is a certain percentage of the fair market value that is determined by local assessors to be the total taxable value of land and additions on the property. | Land | Improvement |
|---|---|---|---|---|
| 2025 | $1,029 | $77,456 | $77,456 | -- |
| 2024 | $1,029 | $73,561 | $73,561 | -- |
| 2023 | $1,077 | $74,796 | $74,796 | $0 |
| 2022 | $1,015 | $63,705 | $63,705 | $0 |
| 2021 | $607 | $34,765 | $32,485 | $2,280 |
| 2020 | $536 | $30,497 | $27,806 | $2,691 |
| 2019 | $447 | $24,788 | $22,723 | $2,065 |
| 2018 | $338 | $18,762 | $16,762 | $2,000 |
| 2017 | $280 | $14,854 | $12,900 | $1,954 |
| 2016 | $280 | $15,528 | $13,713 | $1,815 |
| 2015 | $280 | $15,410 | $13,713 | $1,697 |
| 2014 | $223 | $13,045 | $11,434 | $1,611 |
Property History
| Date | Event | Price | Change | Sq Ft Price |
|---|---|---|---|---|
| 09/09/2025 09/09/25 | Price Changed | $75,000 | -11.8% | $2 / Sq Ft |
| 09/02/2025 09/02/25 | Price Changed | $85,000 | -14.1% | $2 / Sq Ft |
| 07/22/2025 07/22/25 | Price Changed | $99,000 | -34.0% | $3 / Sq Ft |
| 07/08/2025 07/08/25 | For Sale | $150,000 | -- | $4 / Sq Ft |
Purchase History
| Date | Type | Sale Price | Title Company |
|---|---|---|---|
| Warranty Deed | -- | None Available | |
| Warranty Deed | -- | Rtc |
Source: San Antonio Board of REALTORS®
MLS Number: 1882276
APN: 2G0014-0000-10900-0-00
Disclaimer: Certain information contained herein is derived from information provided by parties other than Homes.com. All information provided is deemed reliable, but is not guaranteed to be accurate and should be independently verified.
![]() IDX information is provided exclusively for personal, non-commercial use, and may not be used for any purpose other than to identify prospective properties consumers may be interested in purchasing.
IDX information is provided exclusively for personal, non-commercial use, and may not be used for any purpose other than to identify prospective properties consumers may be interested in purchasing.
Information is deemed reliable but not guaranteed.
- TBD Dowdy Rd
- 0 Dowdy Rd
- 2252 Bluestem Crest Ln
- 862 Dowdy Rd
- 760 Dowdy Rd
- 0 Old Seguin Luling Rd Unit 588407
- 9412 Sycamore Shade Ln
- 600 Domino Five
- 437 Firefly Field Ln
- 11089 Highway 90 Alternate
- 11089 Alternate 90
- 530 Indian Springs Dr
- 9057 Sycamore Shade Ln
- 1250 Darst Creek Ln
- 400 Anderson Hill
- 0 Tract 6 Cross Rd
- TRACT 1 Cross Rd
- TRACT 2 Cross Rd
- 0 Appling Rd
- 1900 Appling Rd
- 274 Kristine Ln
- 4839 Gander Slough Rd
- 3701 Auxiliary Airport Rd
- 707 Old Seguin Luling Rd
- 10195 Wilke Rd
- 55 Brieger Rd
- 316 Mulberry Ave S
- 712 S Walnut Ave
- 661 W Austin St Unit M
- 703 S Laurel Ave
- 613.5 S Laurel Ave
- 203 E Bowie St Unit 1
- 221 Peach St
- 516 E Bowie St
- 317 S Magnolia Ave
- 326 Muehl Rd
- 2090 E U S Highway 90
- 1665 Driftwood Dr
- 1006 E Fannin St
- 132 Talon Dr