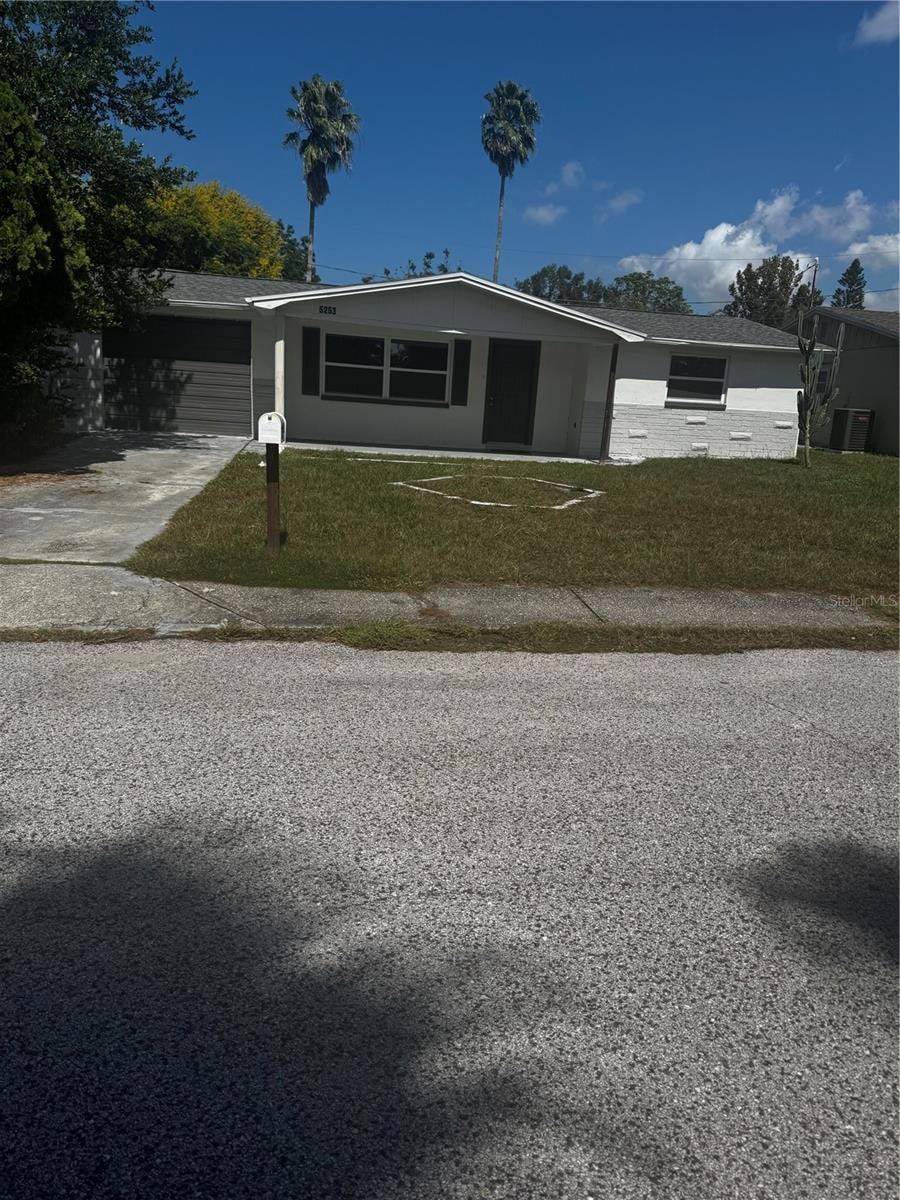
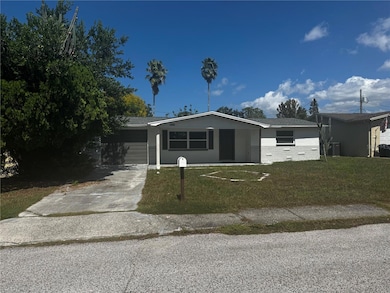
5253 Devries Dr New Port Richey, FL 34652
Estimated payment $1,819/month
Highlights
- Open Floorplan
- No HOA
- 1 Car Attached Garage
- Stone Countertops
- Family Room Off Kitchen
- Living Room
About This Home
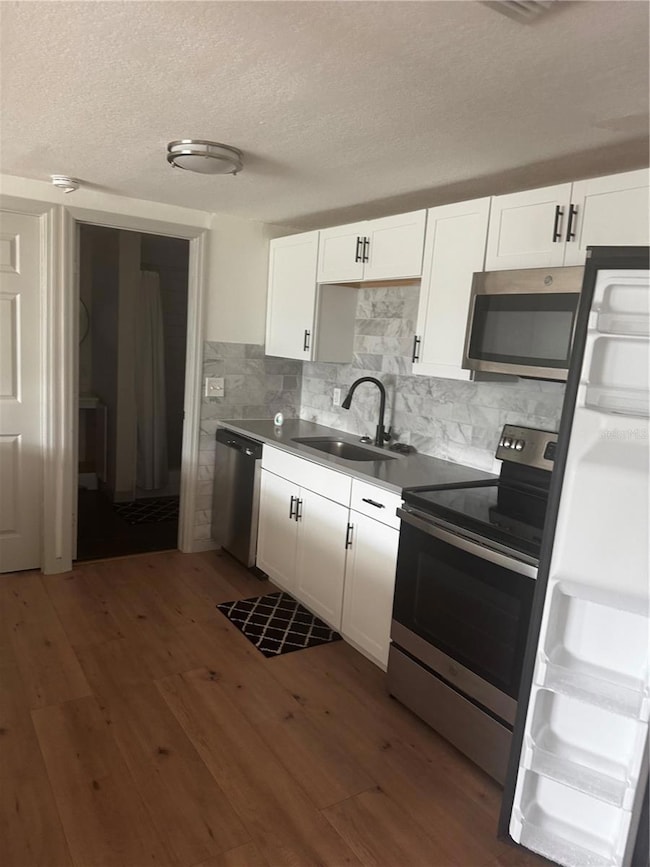
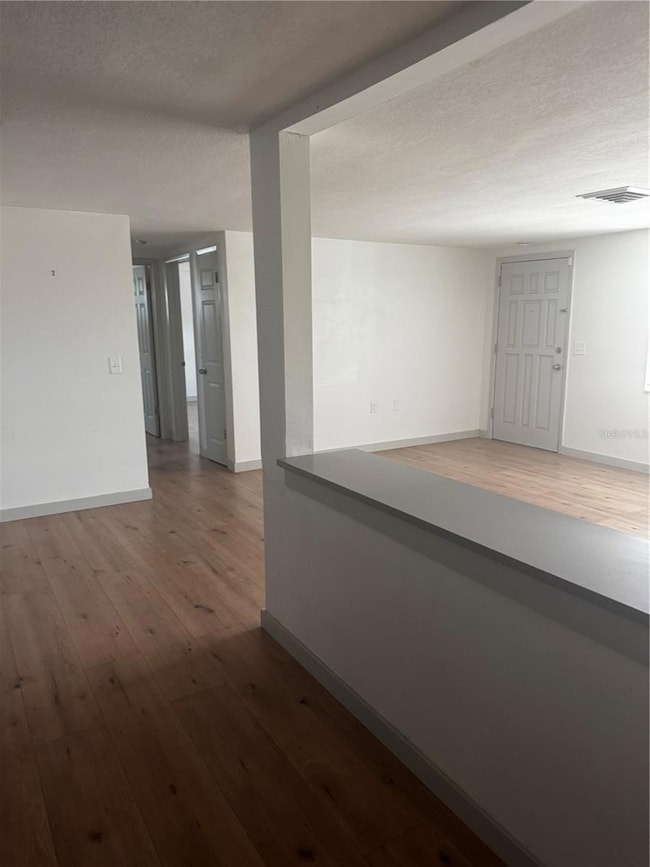
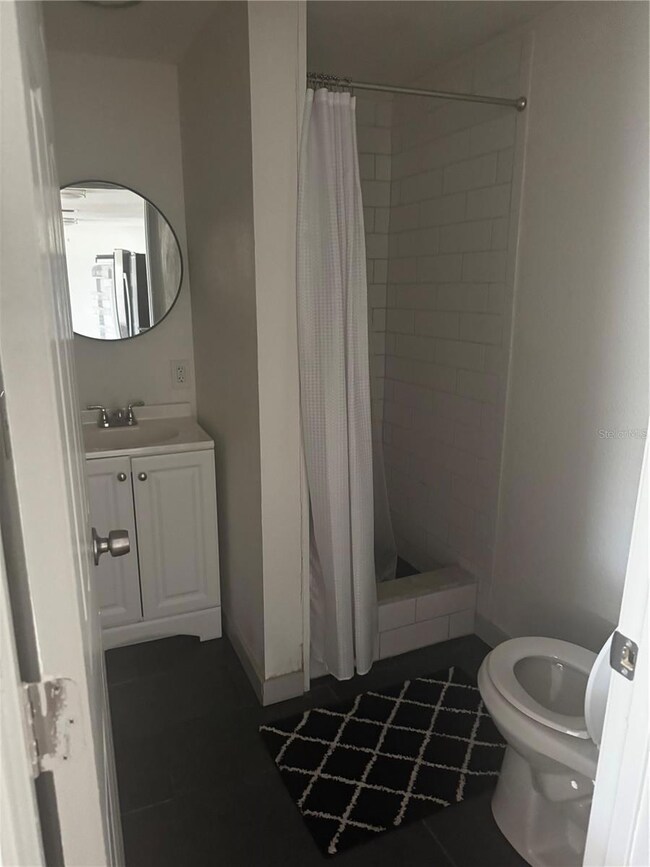
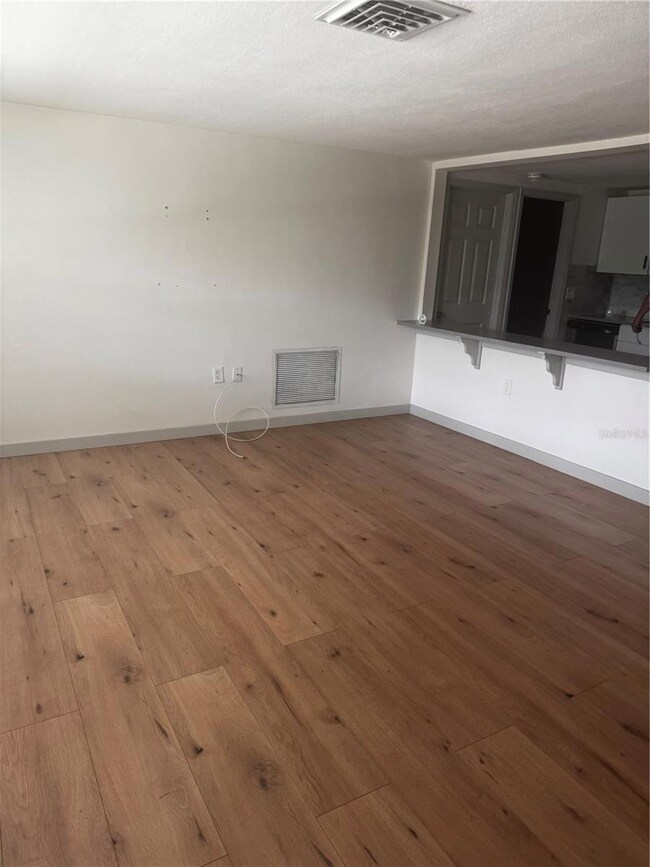
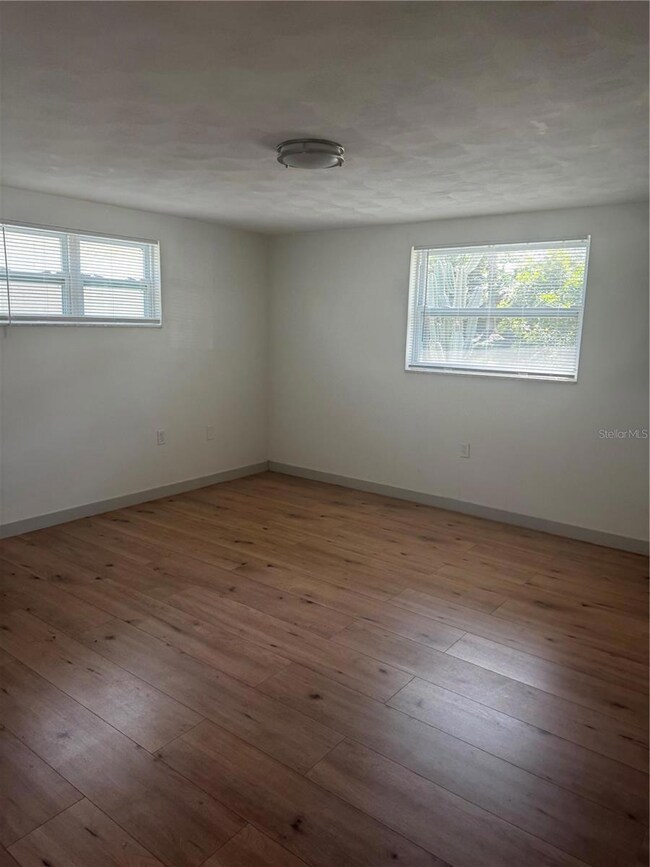
Move-in ready 3BR/2BA with 1-car garage and a fully fenced backyard. Inside, a bright neutral palette pairs with wood-look laminate flooring for a clean, modern feel. The refreshed kitchen features white shaker cabinetry with black hardware, quartz countertops, tile backsplash, stainless appliances, and a sleek black faucet—opening to the living room via a wide pass-through/serving bar for easy entertaining. Both bathrooms are updated with subway-tile surrounds (one step-in shower, one tub/shower combo). Major systems are done: roof (2022), A/C (2022), and updated electrical panel. 3rd bedroom offers convenient exterior-door access—great for an office or flex space. Covered front entry, plenty of yard for pets/gardening, and a central New Port Richey location close to shopping, dining, parks, and US-19. Clean, stylish, and easy to show!
Listing Agent
CHARLES RUTENBERG REALTY INC Brokerage Phone: 866-580-6402 License #3101882 Listed on: 10/03/2025

Home Details
Home Type
- Single Family
Est. Annual Taxes
- $3,554
Year Built
- Built in 1971
Lot Details
- 5,100 Sq Ft Lot
- South Facing Home
- Fenced
- Property is zoned R4
Parking
- 1 Car Attached Garage
Home Design
- Slab Foundation
- Shingle Roof
- Block Exterior
- Stucco
Interior Spaces
- 1,128 Sq Ft Home
- 1-Story Property
- Open Floorplan
- Family Room Off Kitchen
- Living Room
- Dining Room
- Laminate Flooring
- Laundry in Garage
Kitchen
- Range
- Microwave
- Dishwasher
- Stone Countertops
Bedrooms and Bathrooms
- 3 Bedrooms
- 2 Full Bathrooms
Schools
- Anclote Elementary School
- Gulf Middle School
- Gulf High School
Utilities
- Central Heating and Cooling System
Community Details
- No Home Owners Association
- Spring Lake Estates Subdivision
Listing and Financial Details
- Visit Down Payment Resource Website
- Tax Lot 139
- Assessor Parcel Number 16-26-17-058.B-000.00-139.0
Map
Home Values in the Area
Average Home Value in this Area
Tax History
| Year | Tax Paid | Tax Assessment Tax Assessment Total Assessment is a certain percentage of the fair market value that is determined by local assessors to be the total taxable value of land and additions on the property. | Land | Improvement |
|---|---|---|---|---|
| 2025 | $3,554 | $194,579 | $30,498 | $164,081 |
| 2024 | $3,554 | $196,082 | $30,498 | $165,584 |
| 2023 | $2,723 | $133,110 | $0 | $0 |
| 2022 | $2,117 | $121,015 | $19,533 | $101,482 |
| 2021 | $1,528 | $98,179 | $17,085 | $81,094 |
| 2020 | $1,440 | $95,049 | $12,240 | $82,809 |
| 2019 | $1,317 | $83,196 | $10,200 | $72,996 |
| 2018 | $1,181 | $70,201 | $10,200 | $60,001 |
| 2017 | $1,106 | $63,148 | $12,240 | $50,908 |
| 2016 | $996 | $56,802 | $12,240 | $44,562 |
| 2015 | $964 | $55,247 | $12,240 | $43,007 |
| 2014 | $825 | $44,224 | $10,200 | $34,024 |
Property History
| Date | Event | Price | List to Sale | Price per Sq Ft |
|---|---|---|---|---|
| 10/03/2025 10/03/25 | For Sale | $289,000 | -- | $256 / Sq Ft |
Purchase History
| Date | Type | Sale Price | Title Company |
|---|---|---|---|
| Special Warranty Deed | $240,000 | Digital Title | |
| Assignment Deed | -- | None Available | |
| Warranty Deed | $110,000 | Giannell Title Llc | |
| Warranty Deed | $75,000 | Giannell Title Llc | |
| Interfamily Deed Transfer | -- | Attorney |
Mortgage History
| Date | Status | Loan Amount | Loan Type |
|---|---|---|---|
| Previous Owner | $138,141 | Commercial |
Source: Stellar MLS
MLS Number: TB8434153
APN: 17-26-16-058B-00000-1390
Disclaimer: Certain information contained herein is derived from information provided by parties other than Homes.com. All information provided is deemed reliable, but is not guaranteed to be accurate and should be independently verified.
![]() IDX information is provided exclusively for personal, non-commercial use, and may not be used for any purpose other than to identify prospective properties consumers may be interested in purchasing. Information is deemed reliable but not guaranteed.
IDX information is provided exclusively for personal, non-commercial use, and may not be used for any purpose other than to identify prospective properties consumers may be interested in purchasing. Information is deemed reliable but not guaranteed.
Listing Information presented by local MLS brokerage: Ten-X - (888)-952-6393
- 5038 Galaxy Dr
- 5115 Drift Tide Dr
- 5548 Olympia St
- 4424 Terry Loop
- 4201 Wiggins Dr
- 5040 Beacon Hill Dr
- 4453 Terry Loop
- 3645 Galway Dr
- 3632 Pensdale Dr
- 3841 Chaffey Dr
- 5646 Ashen Ave
- 4906 Uranus Ave
- 0 Grand Blvd
- 5120 Cicero Dr
- 4423 Kohler St
- 3802 Mynabird Dr
- 3744 Carron St
- 3735 Mynabird Dr
- 4024 Barker Dr
- 5200 Dove Dr
- 5424 Drift Tide Dr
- 4128 & 4126 Shoreline Dr
- 4116 Grand Blvd
- 5015 Overton Dr
- 5128 Dove Dr
- 5122 Dove Dr
- 3607 Cambridge St
- 3654 Yellowbird Dr
- 3600 Berkshire St
- 5546 Moog Rd
- 4636 Irene Loop Unit 1
- 5924 Ashen Ave
- 5626 Moog Rd
- 5606 Andrea Dr
- 4746 Azalea Dr Unit 105
- 5702 Moog Rd
- 5703 Andrea Dr
- 3506 Blackhawk Dr
- 5850 13th Ave
- 3508 Bedford St