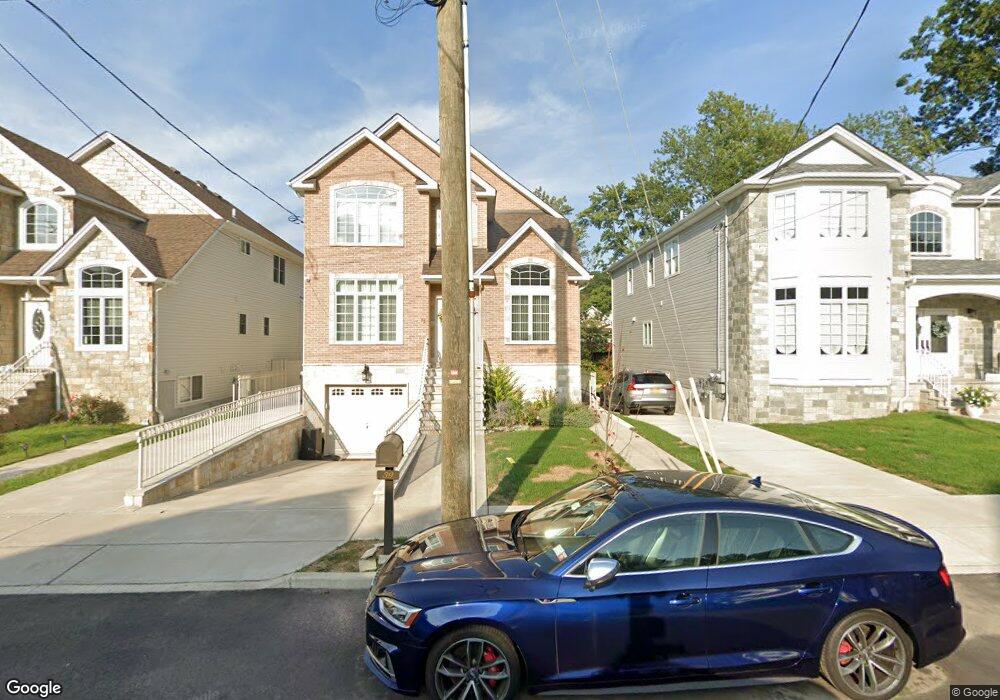
5254 Amboy Rd Staten Island, NY 10312
Huguenot NeighborhoodEstimated Value: $1,152,569 - $1,539,000
--
Bed
--
Bath
2,363
Sq Ft
$560/Sq Ft
Est. Value
About This Home
This home is located at 5254 Amboy Rd, Staten Island, NY 10312 and is currently estimated at $1,322,392, approximately $559 per square foot. 5254 Amboy Rd is a home located in Richmond County with nearby schools including P.S. 5 - Huguenot, I.S. 007 Elias Bernstein, and Tottenville High School.
Ownership History
Date
Name
Owned For
Owner Type
Purchase Details
Closed on
Jun 26, 2017
Sold by
Serena Court Llc
Bought by
Levy Don and Levy Rachel
Current Estimated Value
Home Financials for this Owner
Home Financials are based on the most recent Mortgage that was taken out on this home.
Original Mortgage
$788,664
Outstanding Balance
$664,229
Interest Rate
4.4%
Mortgage Type
FHA
Estimated Equity
$658,163
Purchase Details
Closed on
Feb 20, 2015
Sold by
Savo Ottavio
Bought by
Serena Court Llc
Purchase Details
Closed on
Dec 27, 2014
Sold by
Ovas Building Corp
Bought by
Savo Ottavio
Purchase Details
Closed on
Oct 25, 2001
Sold by
Right Frontage Road Inc
Bought by
Ovas Building Corp
Home Financials for this Owner
Home Financials are based on the most recent Mortgage that was taken out on this home.
Original Mortgage
$200,000
Interest Rate
6.84%
Purchase Details
Closed on
Jun 20, 1997
Sold by
Viola Vincent and Viola Ella
Bought by
Right Frontage Road Inc
Create a Home Valuation Report for This Property
The Home Valuation Report is an in-depth analysis detailing your home's value as well as a comparison with similar homes in the area
Home Values in the Area
Average Home Value in this Area
Purchase History
| Date | Buyer | Sale Price | Title Company |
|---|---|---|---|
| Levy Don | $870,900 | Clearpoint Title Agency | |
| Serena Court Llc | -- | None Available | |
| Savo Ottavio | $1,966,500 | None Available | |
| Ovas Building Corp | $900,000 | -- | |
| Right Frontage Road Inc | $495,000 | Prestige Title Agency Inc |
Source: Public Records
Mortgage History
| Date | Status | Borrower | Loan Amount |
|---|---|---|---|
| Open | Levy Don | $788,664 | |
| Previous Owner | Ovas Building Corp | $200,000 |
Source: Public Records
Tax History Compared to Growth
Tax History
| Year | Tax Paid | Tax Assessment Tax Assessment Total Assessment is a certain percentage of the fair market value that is determined by local assessors to be the total taxable value of land and additions on the property. | Land | Improvement |
|---|---|---|---|---|
| 2025 | $11,439 | $69,840 | $739 | $69,101 |
| 2024 | $11,439 | $64,500 | $795 | $63,705 |
| 2023 | $10,912 | $53,730 | $729 | $53,001 |
| 2022 | $10,119 | $56,880 | $900 | $55,980 |
| 2021 | $10,064 | $47,820 | $900 | $46,920 |
| 2020 | $11,189 | $52,860 | $900 | $51,960 |
| 2019 | $11,121 | $53,160 | $900 | $52,260 |
| 2017 | $4,132 | $20,271 | $734 | $19,537 |
| 2016 | $10,111 | $50,580 | $50,580 | $0 |
| 2015 | $12,689 | $67,879 | $48,575 | $19,304 |
| 2014 | $12,689 | $66,120 | $50,580 | $15,540 |
Source: Public Records
Map
Nearby Homes
- 5300 Amboy Rd
- 67 Archwood Ave
- 199 Downes Ave
- 224 Albee Ave
- 218 Albee Ave
- 274 S Railroad St
- 56 Stecher St
- 76 Downes Ave
- 50 Buffington Ave
- 8 Poillon Ave
- 46 Poillon Ave
- 50 Poillon Ave
- 54 Poillon Ave
- 26 Buffington Ave
- 5434 Amboy Rd
- 164 N Railroad St
- 998 Annadale Rd
- 374 Billiou St
- 158 Kingdom Ave
- 10 Arbutus Way