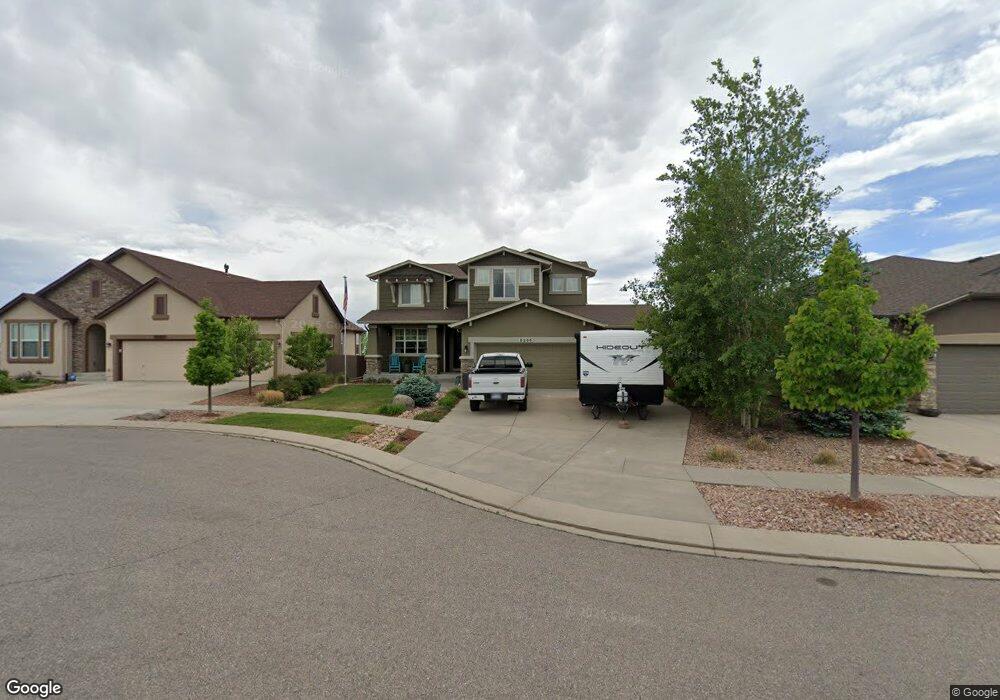
5255 Eldorado Canyon Ct Colorado Springs, CO 80924
Wolf Ranch NeighborhoodEstimated Value: $791,209 - $848,000
5
Beds
4
Baths
3,628
Sq Ft
$225/Sq Ft
Est. Value
About This Home
This home is located at 5255 Eldorado Canyon Ct, Colorado Springs, CO 80924 and is currently estimated at $815,302, approximately $224 per square foot. 5255 Eldorado Canyon Ct is a home located in El Paso County with nearby schools including Chinook Trail Elementary School, Challenger Middle School, and Pine Creek High School.
Ownership History
Date
Name
Owned For
Owner Type
Purchase Details
Closed on
Jun 15, 2018
Sold by
Wilder Matthew D and Wilder Alecia C
Bought by
Bohner Ryan and Bohner Emily
Current Estimated Value
Home Financials for this Owner
Home Financials are based on the most recent Mortgage that was taken out on this home.
Original Mortgage
$458,662
Outstanding Balance
$397,554
Interest Rate
4.6%
Mortgage Type
VA
Estimated Equity
$417,748
Purchase Details
Closed on
Feb 5, 2014
Sold by
Keller Homes Inc
Bought by
Wilder Matthew D and Wilder Alecia C
Home Financials for this Owner
Home Financials are based on the most recent Mortgage that was taken out on this home.
Original Mortgage
$373,331
Interest Rate
4.51%
Mortgage Type
New Conventional
Purchase Details
Closed on
Sep 13, 2013
Sold by
High Valley Land Company Inc
Bought by
Sr Holdings Llc
Create a Home Valuation Report for This Property
The Home Valuation Report is an in-depth analysis detailing your home's value as well as a comparison with similar homes in the area
Home Values in the Area
Average Home Value in this Area
Purchase History
| Date | Buyer | Sale Price | Title Company |
|---|---|---|---|
| Bohner Ryan | $560,000 | Capstone Title Services Llc | |
| Wilder Matthew D | $466,664 | Land Title Guarantee Company | |
| Keller Homes Inc | $284,402 | Land Title Guarantee Company | |
| Sr Holdings Llc | $80,000 | Land Title Guarantee Company |
Source: Public Records
Mortgage History
| Date | Status | Borrower | Loan Amount |
|---|---|---|---|
| Open | Bohner Ryan | $458,662 | |
| Previous Owner | Wilder Matthew D | $373,331 |
Source: Public Records
Tax History Compared to Growth
Tax History
| Year | Tax Paid | Tax Assessment Tax Assessment Total Assessment is a certain percentage of the fair market value that is determined by local assessors to be the total taxable value of land and additions on the property. | Land | Improvement |
|---|---|---|---|---|
| 2025 | $2,945 | $55,270 | -- | -- |
| 2024 | $2,938 | $52,760 | $8,840 | $43,920 |
| 2022 | $2,566 | $38,780 | $8,130 | $30,650 |
| 2021 | $3,031 | $39,900 | $8,370 | $31,530 |
| 2020 | $3,373 | $37,640 | $7,260 | $30,380 |
| 2019 | $3,343 | $37,640 | $7,260 | $30,380 |
| 2018 | $2,862 | $31,680 | $5,390 | $26,290 |
| 2017 | $2,855 | $31,680 | $5,390 | $26,290 |
| 2016 | $2,874 | $31,840 | $5,330 | $26,510 |
| 2015 | $2,871 | $31,840 | $5,330 | $26,510 |
| 2014 | $1,897 | $20,990 | $5,090 | $15,900 |
Source: Public Records
Map
Nearby Homes
- 5218 Eldorado Canyon Ct
- 5719 Adkisson Place
- 5359 Mount Cutler Ct
- 10090 Manhattan Dr
- 10112 Thrive Ln
- 7389 Knapp Dr
- Brooks Plan at Wolf Ranch - Classic Collection
- Monarch Plan at Wolf Ranch - Classic Collection
- Savannah Plan at Wolf Ranch - Classic Collection
- Daybreak Plan at Wolf Ranch - Classic Collection
- Marigold Plan at Wolf Ranch - 4-Square Collection
- Grandview Plan at Wolf Ranch - Classic Collection
- Blossom Plan at Wolf Ranch - 4-Square Collection
- Jubilee Plan at Wolf Ranch - Classic Collection
- Capstone Plan at Wolf Ranch - Classic Collection
- Frisco Plan at Wolf Ranch - Classic Collection
- Jasmine Plan at Wolf Ranch - 4-Square Collection
- Infinity Plan at Wolf Ranch - Classic Collection
- Dynasty Plan at Wolf Ranch - Classic Collection
- Sierra Plan at Wolf Ranch - Classic Collection
- 5243 Eldorado Canyon Ct
- 5267 Eldorado Canyon Ct
- 5231 Eldorado Canyon Ct
- 5280 Castlewood Canyon Ct
- 5268 Castlewood Canyon Ct
- 5219 Eldorado Canyon Ct
- 5292 Castlewood Canyon Ct
- 5254 Eldorado Canyon Ct
- 5242 Eldorado Canyon Ct
- 5256 Castlewood Canyon Ct
- 5266 Eldorado Canyon Ct
- 5230 Eldorado Canyon Ct
- 5710 Griffin Dr
- 5207 Eldorado Canyon Ct
- 5244 Castlewood Canyon Ct
- 5707 Adkisson Place
- 5711 Griffin Dr
- 5281 Castlewood Canyon Ct
- 5195 Eldorado Canyon Ct
- 5232 Castlewood Canyon Ct