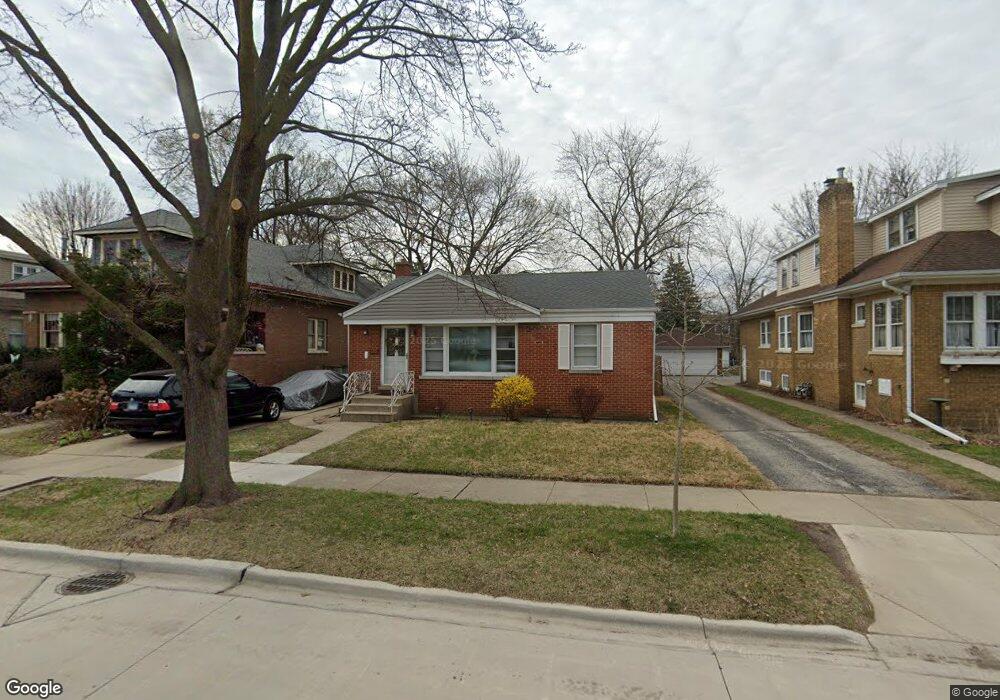
5255 George St Skokie, IL 60077
Southwest Skokie NeighborhoodEstimated Value: $343,000 - $398,241
2
Beds
1
Bath
896
Sq Ft
$419/Sq Ft
Est. Value
About This Home
This home is located at 5255 George St, Skokie, IL 60077 and is currently estimated at $375,060, approximately $418 per square foot. 5255 George St is a home located in Cook County with nearby schools including Madison Elementary School, Thomas Edison Elementary School, and Lincoln Junior High School.
Ownership History
Date
Name
Owned For
Owner Type
Purchase Details
Closed on
Dec 15, 2011
Sold by
Sarris Thomas D
Bought by
Sarris Dina H
Current Estimated Value
Purchase Details
Closed on
Jun 19, 2003
Sold by
Jovanovic Aleksandra and Sarris Aleksandra
Bought by
Sarris Thomas D
Purchase Details
Closed on
Jan 19, 1999
Sold by
Sarris Thomas D
Bought by
Sarris Thomas D and Sarris Aleksandra
Home Financials for this Owner
Home Financials are based on the most recent Mortgage that was taken out on this home.
Original Mortgage
$98,500
Outstanding Balance
$22,945
Interest Rate
6.81%
Estimated Equity
$352,115
Purchase Details
Closed on
Aug 18, 1994
Sold by
Huber Hattie Louise
Bought by
Sarris Thomas D
Home Financials for this Owner
Home Financials are based on the most recent Mortgage that was taken out on this home.
Original Mortgage
$98,000
Interest Rate
8.62%
Create a Home Valuation Report for This Property
The Home Valuation Report is an in-depth analysis detailing your home's value as well as a comparison with similar homes in the area
Home Values in the Area
Average Home Value in this Area
Purchase History
| Date | Buyer | Sale Price | Title Company |
|---|---|---|---|
| Sarris Dina H | -- | None Available | |
| Sarris Thomas D | -- | -- | |
| Sarris Thomas D | -- | -- | |
| Sarris Thomas D | $140,000 | -- |
Source: Public Records
Mortgage History
| Date | Status | Borrower | Loan Amount |
|---|---|---|---|
| Open | Sarris Thomas D | $98,500 | |
| Closed | Sarris Thomas D | $98,000 |
Source: Public Records
Tax History Compared to Growth
Tax History
| Year | Tax Paid | Tax Assessment Tax Assessment Total Assessment is a certain percentage of the fair market value that is determined by local assessors to be the total taxable value of land and additions on the property. | Land | Improvement |
|---|---|---|---|---|
| 2024 | $7,075 | $26,000 | $9,555 | $16,445 |
| 2023 | $7,039 | $26,000 | $9,555 | $16,445 |
| 2022 | $7,039 | $26,000 | $9,555 | $16,445 |
| 2021 | $5,205 | $17,703 | $5,880 | $11,823 |
| 2020 | $5,250 | $17,703 | $5,880 | $11,823 |
| 2019 | $5,292 | $19,891 | $5,880 | $14,011 |
| 2018 | $5,997 | $20,186 | $5,328 | $14,858 |
| 2017 | $6,045 | $20,186 | $5,328 | $14,858 |
| 2016 | $6,409 | $21,411 | $5,328 | $16,083 |
| 2015 | $5,509 | $18,051 | $4,593 | $13,458 |
| 2014 | $5,786 | $19,144 | $4,593 | $14,551 |
| 2013 | $5,842 | $19,144 | $4,593 | $14,551 |
Source: Public Records
Map
Nearby Homes
- 5261 Mulford St
- 5251 Galitz St Unit 410
- 5251 Galitz St Unit 311
- 5207 Galitz St
- 7848 Lincoln Ave
- 5153 Dobson St
- 7748 Lincoln Ave
- 5501 Mulford St
- 5500 Harvard Terrace
- 4953 Oakton St Unit 510
- 4953 Oakton St Unit P11
- 4953 Oakton St Unit 207
- 7507 Frontage Rd
- 7500 Laramie Ave
- 5505 Oakton St
- 4931 Brummel St
- 5000 Oakton St Unit 505
- 4907 Hull St
- 4906 Hull St
- 8128 Laramie Ave
- 5249 George St
- 5261 George St
- 5245 George St
- 5239 George St
- 5271 George St
- 5238 Mulford St
- 5244 Mulford St
- 5234 Mulford St
- 5234 Mulford St
- 5250 Mulford St
- 5230 Mulford St
- 5235 George St
- 5250 George St
- 5262 George St
- 5244 George St
- 5254 Mulford St
- 5224 Mulford St
- 7845 Park Ave
- 5229 George St
- 5240 George St