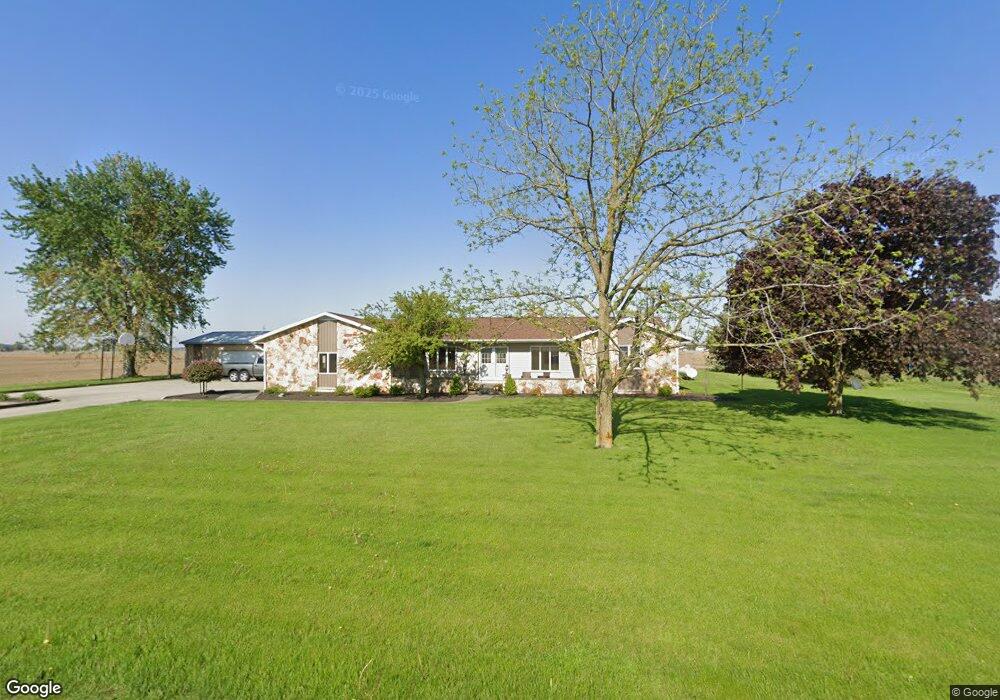
5255 Lehman Rd Delphos, OH 45833
Estimated Value: $246,000 - $294,000
3
Beds
2
Baths
1,715
Sq Ft
$160/Sq Ft
Est. Value
About This Home
This home is located at 5255 Lehman Rd, Delphos, OH 45833 and is currently estimated at $274,499, approximately $160 per square foot. 5255 Lehman Rd is a home located in Allen County with nearby schools including Delphos St. John's Elementary School and Delphos St. John's High School.
Ownership History
Date
Name
Owned For
Owner Type
Purchase Details
Closed on
Feb 28, 2018
Sold by
Pohlman Christopher P
Bought by
Pohlman Christopher P and Pohlman Alyssa J
Current Estimated Value
Purchase Details
Closed on
Sep 1, 2017
Sold by
Ginter Cynthia J and Moorman Cynthia J
Bought by
Pohlman Christopher P
Home Financials for this Owner
Home Financials are based on the most recent Mortgage that was taken out on this home.
Original Mortgage
$146,464
Outstanding Balance
$122,504
Interest Rate
3.96%
Mortgage Type
New Conventional
Estimated Equity
$151,995
Purchase Details
Closed on
Mar 7, 2013
Sold by
Moorman Joel James
Bought by
Ginter Cynthia J and Moorman Cynthia A
Purchase Details
Closed on
Apr 29, 1996
Sold by
Jackson Joseph
Bought by
Ginter Michael and Ginter Cynthia
Home Financials for this Owner
Home Financials are based on the most recent Mortgage that was taken out on this home.
Original Mortgage
$108,000
Interest Rate
7.75%
Mortgage Type
New Conventional
Purchase Details
Closed on
Oct 12, 1993
Sold by
Fischer Sharon K
Bought by
Jackson Joseph D
Purchase Details
Closed on
Feb 1, 1978
Bought by
Fischer Sharon K
Create a Home Valuation Report for This Property
The Home Valuation Report is an in-depth analysis detailing your home's value as well as a comparison with similar homes in the area
Purchase History
| Date | Buyer | Sale Price | Title Company |
|---|---|---|---|
| Pohlman Christopher P | -- | None Available | |
| Pohlman Christopher P | $145,000 | None Available | |
| Ginter Cynthia J | -- | None Available | |
| Ginter Michael | $135,000 | -- | |
| Jackson Joseph D | $100,000 | -- | |
| Fischer Sharon K | -- | -- |
Source: Public Records
Mortgage History
| Date | Status | Borrower | Loan Amount |
|---|---|---|---|
| Open | Pohlman Christopher P | $146,464 | |
| Previous Owner | Ginter Michael | $108,000 |
Source: Public Records
Tax History
| Year | Tax Paid | Tax Assessment Tax Assessment Total Assessment is a certain percentage of the fair market value that is determined by local assessors to be the total taxable value of land and additions on the property. | Land | Improvement |
|---|---|---|---|---|
| 2024 | $2,527 | $81,660 | $11,940 | $69,720 |
| 2023 | $2,108 | $63,280 | $9,240 | $54,040 |
| 2022 | $2,114 | $63,280 | $9,240 | $54,040 |
| 2021 | $2,118 | $63,280 | $9,240 | $54,040 |
| 2020 | $1,680 | $51,980 | $8,400 | $43,580 |
| 2019 | $1,680 | $51,980 | $8,400 | $43,580 |
| 2018 | $1,625 | $51,980 | $8,400 | $43,580 |
| 2017 | $1,572 | $48,020 | $8,400 | $39,620 |
| 2016 | $1,558 | $48,020 | $8,400 | $39,620 |
| 2015 | $1,469 | $48,020 | $8,400 | $39,620 |
| 2014 | $1,469 | $44,840 | $7,740 | $37,100 |
| 2013 | $1,469 | $44,840 | $7,740 | $37,100 |
Source: Public Records
Map
Nearby Homes
- 7110 Elida Rd
- 241 King St
- 827 S Washington St
- 310 E Suthoff St
- 483 S Franklin St
- 8448 Elida Rd
- 424 S Canal St
- 6800 N Defiance Trail
- 821 E 3rd St
- 221 S Main St
- 420 S Cass St
- 405 N Franklin St
- 201 E 5th St
- 1000 Colettas Way
- 708 W 1st St
- 610 N Washington St
- 704 N Franklin St
- 629 N Main St
- 702 N Main St
- 409 N Bredeick St
Your Personal Tour Guide
Ask me questions while you tour the home.