5255 Linnadine Way Norcross, GA 30092
Estimated Value: $874,900 - $1,108,000
4
Beds
3
Baths
3,517
Sq Ft
$279/Sq Ft
Est. Value
About This Home
This home is located at 5255 Linnadine Way, Norcross, GA 30092 and is currently estimated at $982,975, approximately $279 per square foot. 5255 Linnadine Way is a home located in Gwinnett County with nearby schools including Simpson Elementary School, Pinckneyville Middle School, and Norcross High School.
Ownership History
Date
Name
Owned For
Owner Type
Purchase Details
Closed on
Mar 11, 2024
Sold by
Kelly Margaret H
Bought by
Kelly Margaret H
Current Estimated Value
Purchase Details
Closed on
Mar 2, 2022
Sold by
Kelly Margaret Hendricks
Bought by
Kelly Margaret H and Kelly Gene M
Purchase Details
Closed on
Jul 19, 2006
Sold by
Langman David W and Langman Valerie L
Bought by
Kelly Gene M and Kelly Margaret H
Home Financials for this Owner
Home Financials are based on the most recent Mortgage that was taken out on this home.
Original Mortgage
$195,000
Interest Rate
6.6%
Mortgage Type
New Conventional
Purchase Details
Closed on
May 20, 1994
Sold by
Witalis Pete Homes Inc
Bought by
Lagnman David W Valerie
Home Financials for this Owner
Home Financials are based on the most recent Mortgage that was taken out on this home.
Original Mortgage
$217,500
Interest Rate
8.27%
Create a Home Valuation Report for This Property
The Home Valuation Report is an in-depth analysis detailing your home's value as well as a comparison with similar homes in the area
Home Values in the Area
Average Home Value in this Area
Purchase History
| Date | Buyer | Sale Price | Title Company |
|---|---|---|---|
| Kelly Margaret H | -- | -- | |
| Kelly Margaret H | -- | -- | |
| Kelly Gene M | $575,000 | -- | |
| Lagnman David W Valerie | $71,000 | -- |
Source: Public Records
Mortgage History
| Date | Status | Borrower | Loan Amount |
|---|---|---|---|
| Previous Owner | Kelly Gene M | $195,000 | |
| Previous Owner | Lagnman David W Valerie | $217,500 |
Source: Public Records
Tax History Compared to Growth
Tax History
| Year | Tax Paid | Tax Assessment Tax Assessment Total Assessment is a certain percentage of the fair market value that is determined by local assessors to be the total taxable value of land and additions on the property. | Land | Improvement |
|---|---|---|---|---|
| 2025 | $2,888 | $376,240 | $61,960 | $314,280 |
| 2024 | $9,448 | $322,600 | $55,600 | $267,000 |
| 2023 | $9,448 | $322,600 | $55,600 | $267,000 |
| 2022 | $8,541 | $277,720 | $55,600 | $222,120 |
| 2021 | $7,729 | $230,960 | $34,000 | $196,960 |
| 2020 | $7,781 | $230,960 | $34,000 | $196,960 |
| 2019 | $6,622 | $188,840 | $34,000 | $154,840 |
| 2018 | $6,644 | $188,840 | $34,000 | $154,840 |
| 2016 | $6,600 | $188,840 | $34,000 | $154,840 |
| 2015 | $6,680 | $188,840 | $34,000 | $154,840 |
| 2014 | -- | $160,514 | $28,900 | $131,614 |
Source: Public Records
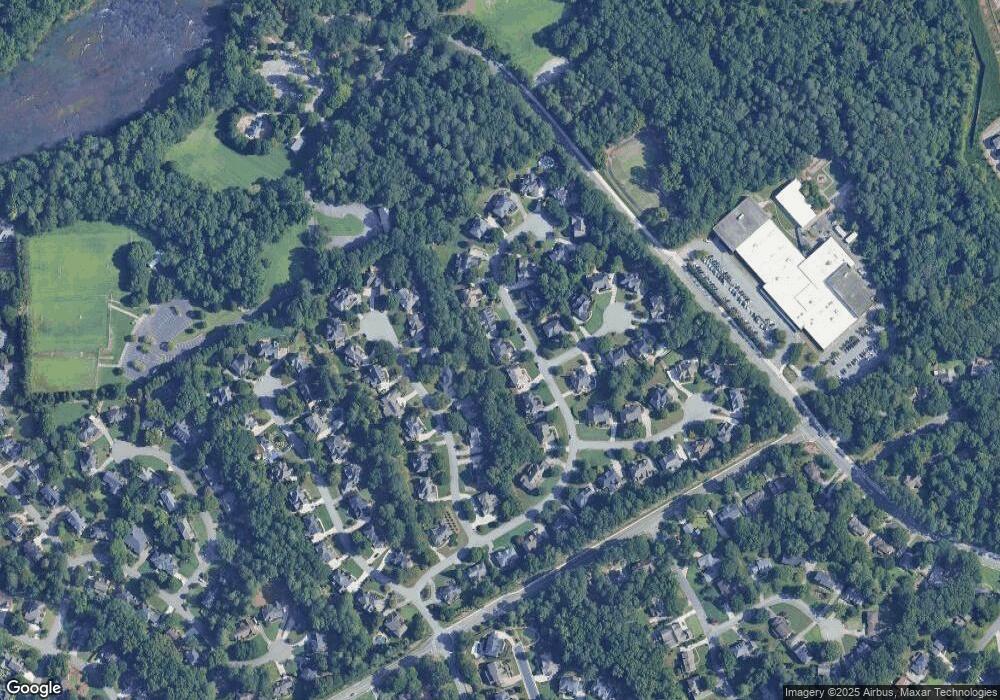
Map
Nearby Homes
- 5354 Fox Hill Dr
- 5692 Broad River View Unit 435
- 5692 Broad River View
- 5397 Valley Mist Ct
- 4531 Outer Bank Dr
- 510 Covington Cove
- 4408 River Trail Dr Unit 382
- 5465 Fort Fisher Way
- 5465 Fort Fisher Way
- 5221 W Jones Bridge Rd
- 4435 River Trail Dr
- 4455 River Trail Dr
- 5350 Wickershire Dr
- 4916 Sudbrook Way Unit 253
- The Adams Plan at Waterside - Condos
- 4457 Watervale Way Unit 292
- 4477 Watervale Way Unit 286
- 5047 Shirley Oaks Dr Unit 313
- 4903 Sudbrook Way Unit 239
- The Stanley Plan at Waterside - Single Family
- 5265 Linnadine Way
- 5245 Linnadine Way Unit II
- 4545 Kings Abbot Way
- 5259 Cottney Croft Way
- 4535 Kings Abbot Way
- 5275 Linnadine Way Unit II
- 5275 Linnadine Way
- 5275 Linnadine Way Unit 2
- 4555 Kings Abbot Way Unit 2
- 5235 Linnadine Way
- 5240 Linnadine Way
- 5270 Linnadine Way
- 4565 Kings Abbot Way
- 4525 Kings Abbot Way
- 5249 Cottney Croft Way Unit 2
- 5220 Linnadine Way
- 5295 Linnadine Way Unit 2
- 5225 Linnadine Way
- 4575 Kings Abbot Way
- 4530 Kings Abbot Way NW