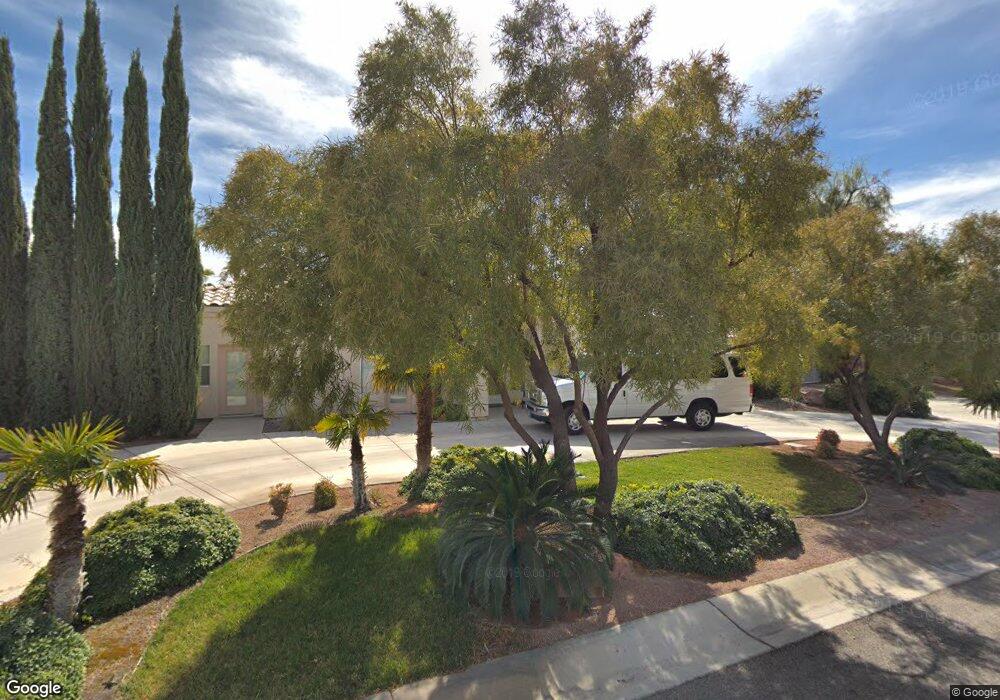
5255 N Campbell Rd Las Vegas, NV 89149
Estimated Value: $725,670 - $847,000
4
Beds
2
Baths
2,389
Sq Ft
$330/Sq Ft
Est. Value
About This Home
This home is located at 5255 N Campbell Rd, Las Vegas, NV 89149 and is currently estimated at $789,168, approximately $330 per square foot. 5255 N Campbell Rd is a home located in Clark County with nearby schools including Dean Lamar Allen Elementary School, Justice Myron E Leavitt Middle School, and Centennial High School.
Ownership History
Date
Name
Owned For
Owner Type
Purchase Details
Closed on
Oct 18, 2021
Sold by
Anderson Randall L and Anderson Charlene
Bought by
Anderson Randall Lee and Anderson Charlene
Current Estimated Value
Purchase Details
Closed on
Dec 21, 2007
Sold by
Anderson Randall Lee
Bought by
Anderson Randall L and Anderson Charlene
Home Financials for this Owner
Home Financials are based on the most recent Mortgage that was taken out on this home.
Original Mortgage
$145,000
Interest Rate
6.21%
Mortgage Type
New Conventional
Create a Home Valuation Report for This Property
The Home Valuation Report is an in-depth analysis detailing your home's value as well as a comparison with similar homes in the area
Home Values in the Area
Average Home Value in this Area
Purchase History
| Date | Buyer | Sale Price | Title Company |
|---|---|---|---|
| Anderson Randall Lee | -- | None Available | |
| Anderson Randall L | -- | Ticor Title Of Nevada Inc |
Source: Public Records
Mortgage History
| Date | Status | Borrower | Loan Amount |
|---|---|---|---|
| Closed | Anderson Randall L | $145,000 |
Source: Public Records
Tax History Compared to Growth
Tax History
| Year | Tax Paid | Tax Assessment Tax Assessment Total Assessment is a certain percentage of the fair market value that is determined by local assessors to be the total taxable value of land and additions on the property. | Land | Improvement |
|---|---|---|---|---|
| 2025 | $2,658 | $167,842 | $80,500 | $87,342 |
| 2024 | $2,581 | $167,842 | $80,500 | $87,342 |
| 2023 | $2,581 | $161,953 | $78,750 | $83,203 |
| 2022 | $2,506 | $146,291 | $70,000 | $76,291 |
| 2021 | $2,433 | $134,254 | $61,250 | $73,004 |
| 2020 | $2,359 | $133,863 | $61,250 | $72,613 |
| 2019 | $2,290 | $132,950 | $61,250 | $71,700 |
| 2018 | $2,224 | $127,138 | $57,750 | $69,388 |
| 2017 | $3,073 | $112,713 | $42,000 | $70,713 |
| 2016 | $2,106 | $103,434 | $31,500 | $71,934 |
| 2015 | $2,102 | $88,492 | $17,500 | $70,992 |
| 2014 | $2,040 | $79,613 | $17,500 | $62,113 |
Source: Public Records
Map
Nearby Homes
- 11127 Rolling Vista Dr
- 9180 W Hammer Ln
- 0 Dapple Gray Rd
- 5315 N Fort Apache Rd
- 5515 N Campbell Rd
- 8842 W Stephen Ave
- 3336 Plan at Homestead West
- 3704 Plan at Homestead West
- 8826 W Stephen Ave
- 8732 Kendall Brook Cir
- 5309 N Chieftain St
- 9340 W Washburn Rd
- 5624 N Dapple Gray Rd
- 5625 Coe Estates Ct
- 5215 N Riley St
- 8975 W Verde Way
- 5685 N Campbell Rd
- 4925 N Juliano Rd
- 8970 W Lone Mountain Rd
- 8775 W Verde Way
- 5285 N Campbell Rd
- 5265 N Campbell Rd
- 5250 N Campbell Rd
- 5275 N Campbell Rd
- 9020 W Washburn Rd
- 8987 W Fisher Ave
- 9060 W Washburn Rd
- 5309 N Campbell Rd
- 8965 W Fisher Ave
- 8978 W Washburn Rd Unit none
- 8978 W Washburn Rd Unit N
- 9050 W Fisher Ave
- 8980 W Fisher Ave
- 9060 W Fisher Ave
- 5286 N Dapple Gray Rd
- 5195 N Campbell Rd
- 5335 N Campbell Rd
- 8930 W Washburn Rd
- 9090 W Fisher Ave
- 5181 N Campbell Rd Unit none