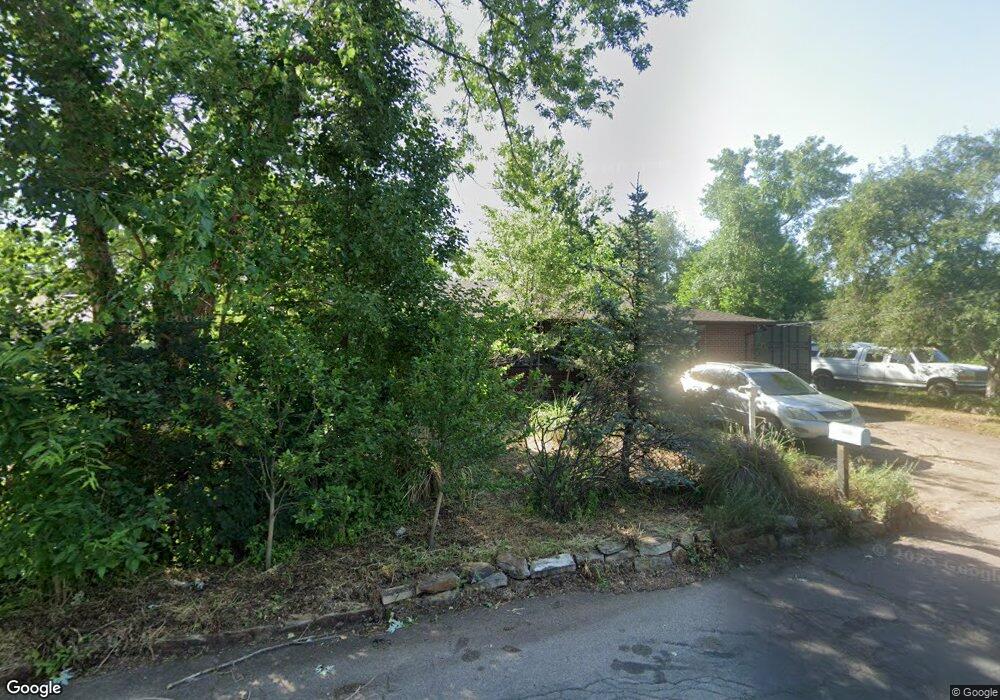
5256 Grove St Denver, CO 80221
Berkley NeighborhoodEstimated Value: $455,000 - $522,000
3
Beds
1
Bath
1,270
Sq Ft
$375/Sq Ft
Est. Value
About This Home
This home is located at 5256 Grove St, Denver, CO 80221 and is currently estimated at $476,507, approximately $375 per square foot. 5256 Grove St is a home located in Adams County with nearby schools including Josephine Hodgkins Leadership Academy, Colorado Sports Leadership Academy, and Westminster High School.
Ownership History
Date
Name
Owned For
Owner Type
Purchase Details
Closed on
Jun 21, 2006
Sold by
Dark Gary D and Dark Marilou L
Bought by
Brock Grace C
Current Estimated Value
Home Financials for this Owner
Home Financials are based on the most recent Mortgage that was taken out on this home.
Original Mortgage
$152,000
Outstanding Balance
$88,935
Interest Rate
6.58%
Mortgage Type
Unknown
Estimated Equity
$387,572
Purchase Details
Closed on
Mar 28, 2003
Sold by
Day Patrick T
Bought by
Dark Marilou L and Dark Gary D
Home Financials for this Owner
Home Financials are based on the most recent Mortgage that was taken out on this home.
Original Mortgage
$134,000
Interest Rate
5.57%
Purchase Details
Closed on
Jun 21, 2002
Sold by
Diette Jeffrey A
Bought by
Santore Paul A and Alarid Santore Rae M
Home Financials for this Owner
Home Financials are based on the most recent Mortgage that was taken out on this home.
Original Mortgage
$197,600
Interest Rate
6.82%
Purchase Details
Closed on
Jun 19, 1992
Sold by
Day Rose M
Bought by
Day Rose M and Day Patrick T
Create a Home Valuation Report for This Property
The Home Valuation Report is an in-depth analysis detailing your home's value as well as a comparison with similar homes in the area
Home Values in the Area
Average Home Value in this Area
Purchase History
| Date | Buyer | Sale Price | Title Company |
|---|---|---|---|
| Brock Grace C | $190,000 | Chicago Title Co | |
| Dark Marilou L | $144,000 | -- | |
| Santore Paul A | $247,000 | Land Title Guarantee Company | |
| Day Rose M | -- | -- |
Source: Public Records
Mortgage History
| Date | Status | Borrower | Loan Amount |
|---|---|---|---|
| Open | Brock Grace C | $152,000 | |
| Previous Owner | Dark Marilou L | $134,000 | |
| Previous Owner | Santore Paul A | $197,600 |
Source: Public Records
Tax History
| Year | Tax Paid | Tax Assessment Tax Assessment Total Assessment is a certain percentage of the fair market value that is determined by local assessors to be the total taxable value of land and additions on the property. | Land | Improvement |
|---|---|---|---|---|
| 2025 | $2,965 | $33,110 | $8,020 | $25,090 |
| 2024 | $2,965 | $30,440 | $7,380 | $23,060 |
| 2023 | $3,618 | $35,240 | $7,980 | $27,260 |
| 2022 | $3,769 | $30,860 | $8,200 | $22,660 |
| 2021 | $3,865 | $30,860 | $8,200 | $22,660 |
| 2020 | $3,301 | $26,840 | $8,440 | $18,400 |
| 2019 | $3,293 | $26,840 | $8,440 | $18,400 |
| 2018 | $2,780 | $22,550 | $6,480 | $16,070 |
| 2017 | $2,435 | $22,550 | $6,480 | $16,070 |
| 2016 | $1,937 | $17,020 | $3,500 | $13,520 |
| 2015 | $1,935 | $17,020 | $3,500 | $13,520 |
| 2014 | $1,583 | $13,340 | $2,790 | $10,550 |
Source: Public Records
Map
Nearby Homes
- 3246 W 53rd Ave
- 3017 W 53rd Ave
- 2876 W 53rd Ave Unit 118
- 2876 W 53rd Ave Unit 107
- 2940 W 54th Ave
- 2835 W Parkside Place Unit 305
- 4990 Hooker St
- 3060 W 55th Place
- 4985 Green Ct
- 4995 Julian St
- 5175 Lowell Blvd
- 2872 W 55th Ave Unit 23
- 4975 Knox Ct
- 3011 W 49th Ave
- 4957 Knox Ct
- 5512 Clay St
- 5516 Clay St
- 4870 Irving St
- 2541 W 52nd Ave
- 3515 W 49th Ave
- 5266 Grove St
- 5261 Grove St
- 5240 Grove St
- 3072 W 53rd Ave
- 5245 Grove St
- 3243 W 52nd Place
- 3082 W 53rd Ave
- 3120 W 53rd Ave
- 3070 W 53rd Ave
- 3140 W 53rd Ave
- 5241 Regis Rd
- 5200 Grove St
- 3050 W 53rd Ave
- 5233 Grove St
- 3021 W 53rd Ave Unit ID1368851P
- 3005 W 53rd Ave
- 3021 W 53rd Ave
- 3019 W 53rd Ave
- 3250 W 53rd Ave
- 3085 W 53rd Ave
Your Personal Tour Guide
Ask me questions while you tour the home.