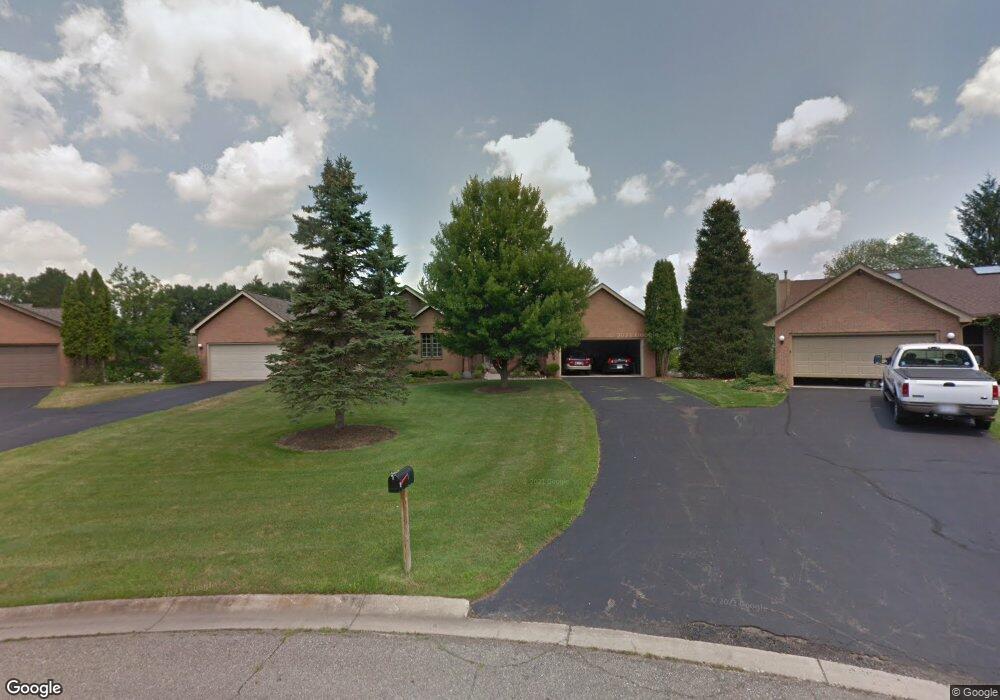
5258 Golden Cir East Lansing, MI 48823
Estimated Value: $338,202 - $479,000
3
Beds
3
Baths
1,901
Sq Ft
$201/Sq Ft
Est. Value
About This Home
This home is located at 5258 Golden Cir, East Lansing, MI 48823 and is currently estimated at $382,551, approximately $201 per square foot. 5258 Golden Cir is a home located in Ingham County with nearby schools including Bennett Woods Elementary School, Kinawa School, and Chippewa Middle School.
Ownership History
Date
Name
Owned For
Owner Type
Purchase Details
Closed on
Nov 23, 2020
Sold by
Dennis Charles F and Dennis Dena K
Bought by
Dennis Charles F and Dennis Dena K
Current Estimated Value
Purchase Details
Closed on
Apr 30, 2013
Sold by
Gerald F Marshall Family Trust
Bought by
Dennis Charles F and Dennis Dena Karlena
Home Financials for this Owner
Home Financials are based on the most recent Mortgage that was taken out on this home.
Original Mortgage
$171,200
Outstanding Balance
$121,749
Interest Rate
3.56%
Mortgage Type
New Conventional
Estimated Equity
$260,802
Purchase Details
Closed on
Sep 10, 2010
Sold by
Marshall Beverly J and Marshall David F
Bought by
Marshall Beverly J and Marshall David F
Purchase Details
Closed on
May 23, 1997
Sold by
Marshall Beverly J
Bought by
Marshall Trust Gerald F
Purchase Details
Closed on
Jun 5, 1995
Bought by
Marshall Beverly J
Purchase Details
Closed on
Feb 13, 1995
Bought by
Dunn Development
Create a Home Valuation Report for This Property
The Home Valuation Report is an in-depth analysis detailing your home's value as well as a comparison with similar homes in the area
Home Values in the Area
Average Home Value in this Area
Purchase History
| Date | Buyer | Sale Price | Title Company |
|---|---|---|---|
| Dennis Charles F | -- | None Available | |
| Dennis Charles F | $214,900 | Tri County Title Agency Llc | |
| Marshall Beverly J | -- | None Available | |
| Marshall Trust Gerald F | -- | -- | |
| Marshall Beverly J | $207,900 | -- | |
| Dunn Development | $31,200 | -- |
Source: Public Records
Mortgage History
| Date | Status | Borrower | Loan Amount |
|---|---|---|---|
| Open | Dennis Charles F | $171,200 |
Source: Public Records
Tax History Compared to Growth
Tax History
| Year | Tax Paid | Tax Assessment Tax Assessment Total Assessment is a certain percentage of the fair market value that is determined by local assessors to be the total taxable value of land and additions on the property. | Land | Improvement |
|---|---|---|---|---|
| 2025 | $5,899 | $164,700 | $0 | $164,700 |
| 2024 | $26 | $155,800 | $0 | $155,800 |
| 2023 | $5,495 | $146,600 | $0 | $146,600 |
| 2022 | $5,256 | $138,200 | $0 | $138,200 |
| 2021 | $5,156 | $135,300 | $0 | $135,300 |
| 2020 | $5,029 | $132,500 | $0 | $132,500 |
| 2019 | $4,906 | $126,900 | $0 | $126,900 |
| 2018 | $4,661 | $112,300 | $0 | $112,300 |
| 2017 | $4,437 | $106,900 | $0 | $106,900 |
| 2016 | $1,984 | $95,800 | $0 | $95,800 |
| 2015 | $1,984 | $89,100 | $0 | $0 |
| 2014 | $1,984 | $87,800 | $0 | $0 |
Source: Public Records
Map
Nearby Homes
- 5283 E Hidden Lake Dr Unit 47
- 5167 Sapphire Cir Unit 25
- 2343 Sapphire Ln Unit 48
- 2545 Koala Dr
- 5162 Sapphire Cir Unit 31
- 5359 Wild Oak Dr Unit 54
- 5403 Wild Oak Dr
- 5403 Jo Pass
- 2462 Burcham Dr
- 2374 N Wild Blossom Ct
- 5420 Park Lake Rd
- 2617 Greencliff Dr
- 5435 Blue Haven Dr
- 5120 Wardcliff Dr
- 2216 Iroquois Rd
- 5680 Deville Ct Unit 61
- 5604 Deville Ct
- 5724 Lebaron Ct
- 5189 E Brookfield Dr
- 1653 Ann St
- 5258 Golden Cir Unit 77
- 5260 Golden Cir Unit 78
- 5254 Golden Cir Unit 76
- 5261 Golden Cir
- 5245 Golden Cir
- 5257 Golden Cir
- 5248 Golden Cir
- 5255 Golden Cir
- 5253 E Hidden Lake Dr
- 5249 E Hidden Lake Dr
- 5249 E Hidden Lake Dr Unit 68
- 5255 E Hidden Lake Dr
- 5257 E Hidden Lake Dr
- 5253 Golden Cir Unit 83
- 5251 E Hidden Lake Dr
- 5259 E Hidden Lake Dr
- 5251 Golden Cir
- 5263 E Hidden Lake Dr
- 5267 E Hidden Lake Dr
- 5246 Golden Cir Unit 72