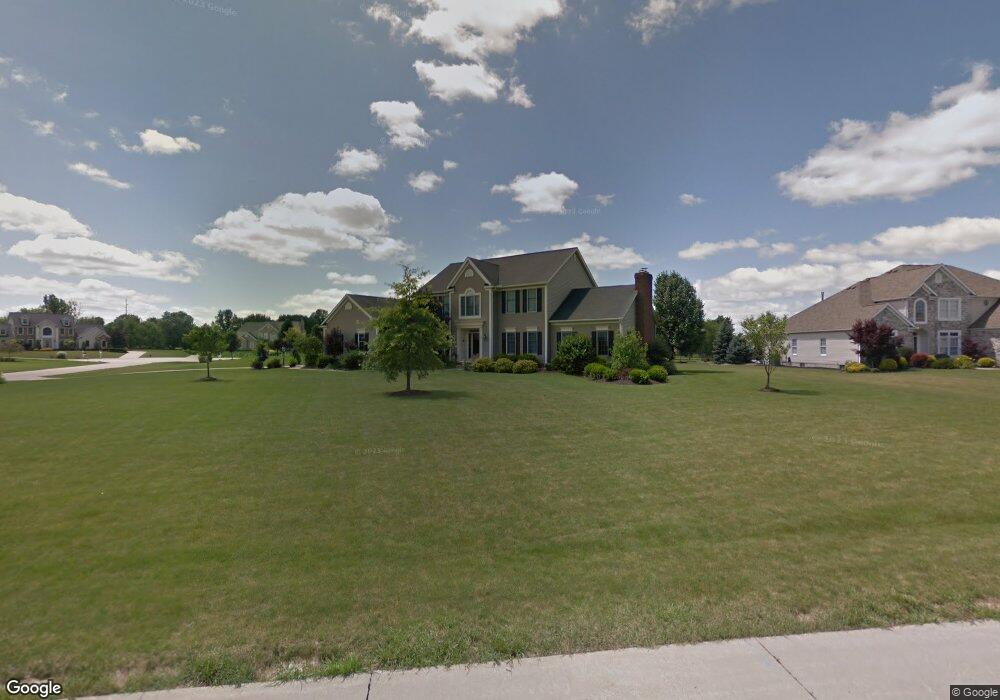
5259 Windchime Dr Medina, OH 44256
Estimated Value: $611,338 - $677,000
6
Beds
4
Baths
3,433
Sq Ft
$189/Sq Ft
Est. Value
About This Home
This home is located at 5259 Windchime Dr, Medina, OH 44256 and is currently estimated at $649,085, approximately $189 per square foot. 5259 Windchime Dr is a home located in Medina County with nearby schools including Garfield Elementary School, Claggett Middle School, and Medina High School.
Ownership History
Date
Name
Owned For
Owner Type
Purchase Details
Closed on
Nov 27, 2019
Sold by
Proctor Justin D
Bought by
Proctor Justin D and Proctor Rachel R
Current Estimated Value
Purchase Details
Closed on
Apr 23, 2014
Sold by
Proctor Elizabeth A
Bought by
Proctor Justin D
Purchase Details
Closed on
Aug 18, 2008
Sold by
Clay Mark A and Clay Ruth G
Bought by
Proctor Justin D
Home Financials for this Owner
Home Financials are based on the most recent Mortgage that was taken out on this home.
Original Mortgage
$230,000
Outstanding Balance
$150,807
Interest Rate
6.31%
Mortgage Type
Future Advance Clause Open End Mortgage
Estimated Equity
$498,278
Purchase Details
Closed on
Dec 23, 1999
Sold by
Prestige & Premier Companies
Bought by
Clay Mark A and Clay Ruth G
Home Financials for this Owner
Home Financials are based on the most recent Mortgage that was taken out on this home.
Original Mortgage
$315,600
Interest Rate
7%
Mortgage Type
Construction
Create a Home Valuation Report for This Property
The Home Valuation Report is an in-depth analysis detailing your home's value as well as a comparison with similar homes in the area
Home Values in the Area
Average Home Value in this Area
Purchase History
| Date | Buyer | Sale Price | Title Company |
|---|---|---|---|
| Proctor Justin D | -- | None Available | |
| Proctor Justin D | -- | None Available | |
| Proctor Justin D | $305,000 | -- | |
| Clay Mark A | $59,900 | -- |
Source: Public Records
Mortgage History
| Date | Status | Borrower | Loan Amount |
|---|---|---|---|
| Open | Proctor Justin D | $230,000 | |
| Previous Owner | Clay Mark A | $315,600 |
Source: Public Records
Tax History Compared to Growth
Tax History
| Year | Tax Paid | Tax Assessment Tax Assessment Total Assessment is a certain percentage of the fair market value that is determined by local assessors to be the total taxable value of land and additions on the property. | Land | Improvement |
|---|---|---|---|---|
| 2024 | $8,176 | $159,970 | $37,780 | $122,190 |
| 2023 | $8,176 | $159,970 | $37,780 | $122,190 |
| 2022 | $7,047 | $159,970 | $37,780 | $122,190 |
| 2021 | $6,740 | $129,010 | $30,470 | $98,540 |
| 2020 | $6,795 | $129,010 | $30,470 | $98,540 |
| 2019 | $6,808 | $129,010 | $30,470 | $98,540 |
| 2018 | $6,891 | $121,270 | $26,210 | $95,060 |
| 2017 | $6,985 | $121,270 | $26,210 | $95,060 |
| 2016 | $7,145 | $121,270 | $26,210 | $95,060 |
| 2015 | $7,187 | $116,200 | $21,140 | $95,060 |
| 2014 | $7,170 | $116,200 | $21,140 | $95,060 |
| 2013 | $7,179 | $116,200 | $21,140 | $95,060 |
Source: Public Records
Map
Nearby Homes
- 5446 Royal Brook Dr
- 3722 Watkins Rd
- 3135 Crooked Creek Cir
- 5315 Genny Dr
- 5035 Red Maple Ct
- 4015 Marks Rd Unit 2D
- S/L 27 Devon Path
- S/L 26 Devon Path
- 4051 Irvine Oval
- 5501 Arapaho Way
- 4525 Fenn Rd
- 1150 Chapman Ln Unit 23
- 3997 Stonegate Dr
- 1168 N Jefferson St Unit U18
- 6154 Spieth Rd
- 6162 Spieth Rd
- 799 Savannah Trail
- 1073 N Jefferson St Unit B
- 6216 Spieth Rd
- 4396 Gladden Place
- 3500 Windsong Dr
- 5273 Windchime Dr
- 5248 Windchime Dr
- 3511 Windsong Dr
- 5260 Morning Song Dr
- 3495 Windsong Dr
- 5262 Windchime Dr
- 3531 Windsong Dr
- 5210 Morning Song Dr
- 5282 Windchime Dr
- 5289 Windchime Dr
- 3560 Windsong Dr
- 5286 Morning Song Dr
- 5237 Morning Song Dr
- 3555 Windsong Dr
- 5225 Morning Song Dr
- 5263 Morning Song Dr
- 3570 Windsong Dr
- 5196 Morning Song Dr
- 5211 Morning Song Dr