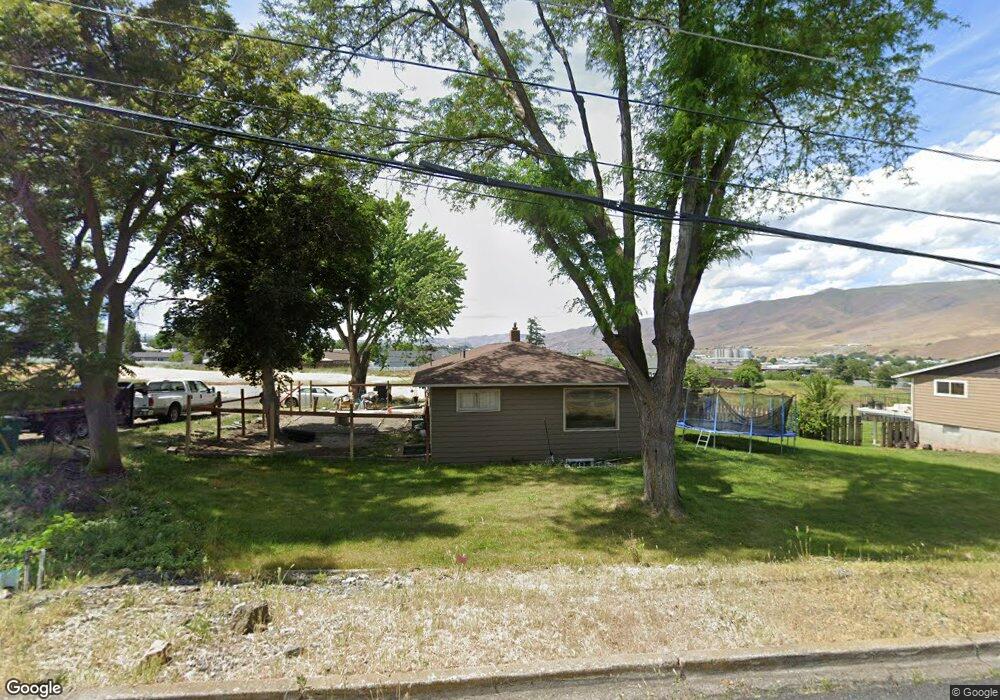
526 29th St Lewiston, ID 83501
Estimated Value: $336,000 - $708,000
2
Beds
2
Baths
2,840
Sq Ft
$154/Sq Ft
Est. Value
About This Home
This home is located at 526 29th St, Lewiston, ID 83501 and is currently estimated at $436,501, approximately $153 per square foot. 526 29th St is a home located in Nez Perce County with nearby schools including Webster Elementary School, Lewiston High School, and All Saints Catholic School.
Ownership History
Date
Name
Owned For
Owner Type
Purchase Details
Closed on
May 26, 2020
Sold by
Clark Richard John
Bought by
Clark Richard John and Clark Kenneth Bradley
Current Estimated Value
Purchase Details
Closed on
Aug 21, 2017
Sold by
Dinnell Forrest J and Dinnell Sharon A
Bought by
Clark Richard John
Home Financials for this Owner
Home Financials are based on the most recent Mortgage that was taken out on this home.
Original Mortgage
$166,200
Outstanding Balance
$138,681
Interest Rate
3.96%
Mortgage Type
Commercial
Estimated Equity
$297,820
Create a Home Valuation Report for This Property
The Home Valuation Report is an in-depth analysis detailing your home's value as well as a comparison with similar homes in the area
Purchase History
| Date | Buyer | Sale Price | Title Company |
|---|---|---|---|
| Clark Richard John | -- | None Available | |
| Clark Richard John | -- | None Available |
Source: Public Records
Mortgage History
| Date | Status | Borrower | Loan Amount |
|---|---|---|---|
| Open | Clark Richard John | $166,200 |
Source: Public Records
Tax History
| Year | Tax Paid | Tax Assessment Tax Assessment Total Assessment is a certain percentage of the fair market value that is determined by local assessors to be the total taxable value of land and additions on the property. | Land | Improvement |
|---|---|---|---|---|
| 2025 | $2,884 | $280,455 | $55,000 | $225,455 |
| 2024 | $31 | $281,721 | $50,500 | $231,221 |
| 2023 | $3,027 | $277,972 | $45,750 | $232,222 |
| 2022 | $3,266 | $258,955 | $39,750 | $219,205 |
| 2021 | $3,089 | $209,151 | $33,000 | $176,151 |
| 2020 | $1,554 | $170,510 | $26,400 | $144,110 |
| 2019 | $1,631 | $150,485 | $26,400 | $124,085 |
| 2018 | $1,554 | $142,233 | $26,400 | $115,833 |
| 2017 | $2,601 | $0 | $0 | $0 |
| 2016 | $2,601 | $0 | $0 | $0 |
| 2015 | $2,336 | $0 | $0 | $0 |
| 2014 | $2,223 | $112,379 | $21,750 | $90,629 |
Source: Public Records
Map
Nearby Homes
Your Personal Tour Guide
Ask me questions while you tour the home.