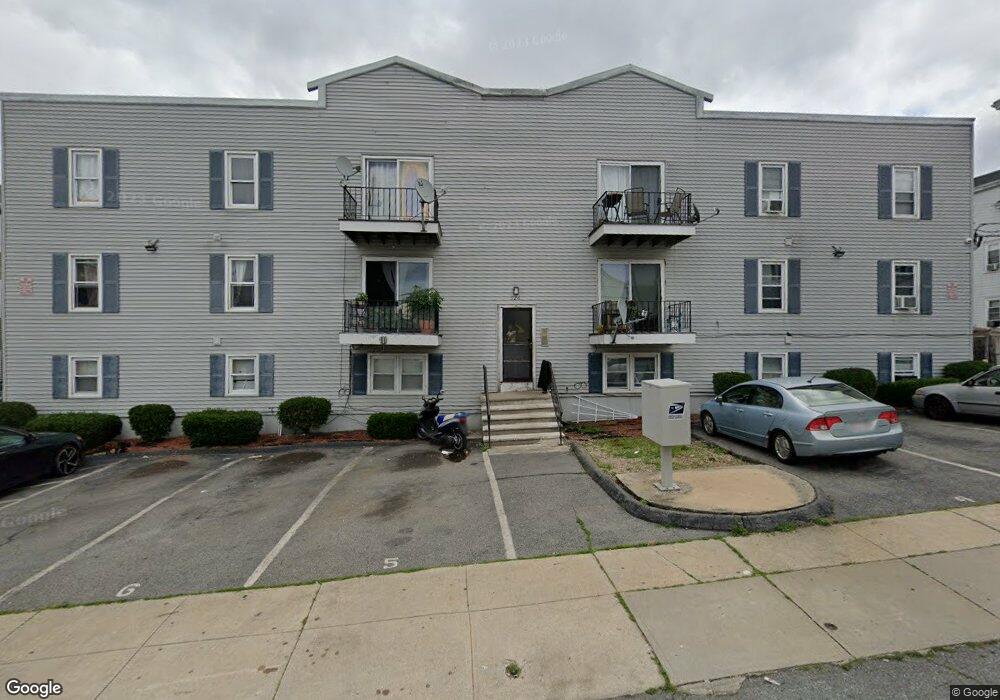
526 3rd St Unit 3 Fall River, MA 02721
Corky Row NeighborhoodEstimated Value: $191,000 - $292,000
Studio
1
Bath
941
Sq Ft
$244/Sq Ft
Est. Value
About This Home
This home is located at 526 3rd St Unit 3, Fall River, MA 02721 and is currently estimated at $230,062, approximately $244 per square foot. 526 3rd St Unit 3 is a home located in Bristol County with nearby schools including Henry Lord Community School, B M C Durfee High School, and Argosy Collegiate Charter School.
Ownership History
Date
Name
Owned For
Owner Type
Purchase Details
Closed on
Sep 13, 2011
Sold by
Baker John R
Bought by
Ulster Condo T and Algarin Adrian
Current Estimated Value
Purchase Details
Closed on
Oct 19, 2005
Sold by
Wade Rlty Corp
Bought by
Algarin Adriana L
Home Financials for this Owner
Home Financials are based on the most recent Mortgage that was taken out on this home.
Original Mortgage
$95,900
Interest Rate
5.72%
Mortgage Type
Purchase Money Mortgage
Create a Home Valuation Report for This Property
The Home Valuation Report is an in-depth analysis detailing your home's value as well as a comparison with similar homes in the area
Home Values in the Area
Average Home Value in this Area
Purchase History
| Date | Buyer | Sale Price | Title Company |
|---|---|---|---|
| Ulster Condo T | $21,500 | -- | |
| Algarin Adriana L | $119,900 | -- |
Source: Public Records
Mortgage History
| Date | Status | Borrower | Loan Amount |
|---|---|---|---|
| Previous Owner | Algarin Adriana L | $95,900 |
Source: Public Records
Tax History
| Year | Tax Paid | Tax Assessment Tax Assessment Total Assessment is a certain percentage of the fair market value that is determined by local assessors to be the total taxable value of land and additions on the property. | Land | Improvement |
|---|---|---|---|---|
| 2025 | $1,539 | $134,400 | $0 | $134,400 |
| 2024 | $1,741 | $151,500 | $0 | $151,500 |
| 2023 | $1,688 | $137,600 | $0 | $137,600 |
| 2022 | $1,607 | $127,300 | $0 | $127,300 |
| 2021 | $1,537 | $111,100 | $0 | $111,100 |
| 2020 | $1,358 | $94,000 | $0 | $94,000 |
| 2019 | $1,319 | $90,500 | $0 | $90,500 |
| 2018 | $1,241 | $84,900 | $0 | $84,900 |
| 2017 | $1,189 | $84,900 | $0 | $84,900 |
| 2016 | $1,124 | $82,500 | $0 | $82,500 |
| 2015 | $1,103 | $84,300 | $0 | $84,300 |
| 2014 | $1,144 | $90,900 | $0 | $90,900 |
Source: Public Records
Map
Nearby Homes
- 526 Third St Unit 4
- 526 Third St Unit 12
- 526 Third St Unit 3
- 526 Third St Unit 1
- 526 Third St Unit 2
- 526 Third St Unit 11
- 526 Third St Unit 6
- 526 3rd St Unit 12
- 526 3rd St Unit 11
- 526 3rd St Unit 10
- 526 3rd St Unit 9
- 526 3rd St Unit 8
- 526 3rd St Unit 7
- 526 3rd St Unit 6
- 526 3rd St Unit 5
- 526 3rd St Unit 4
- 526 3rd St Unit 2
- 526 3rd St Unit 1
- 554 Third St
- 552-554 Third St
Your Personal Tour Guide
Ask me questions while you tour the home.