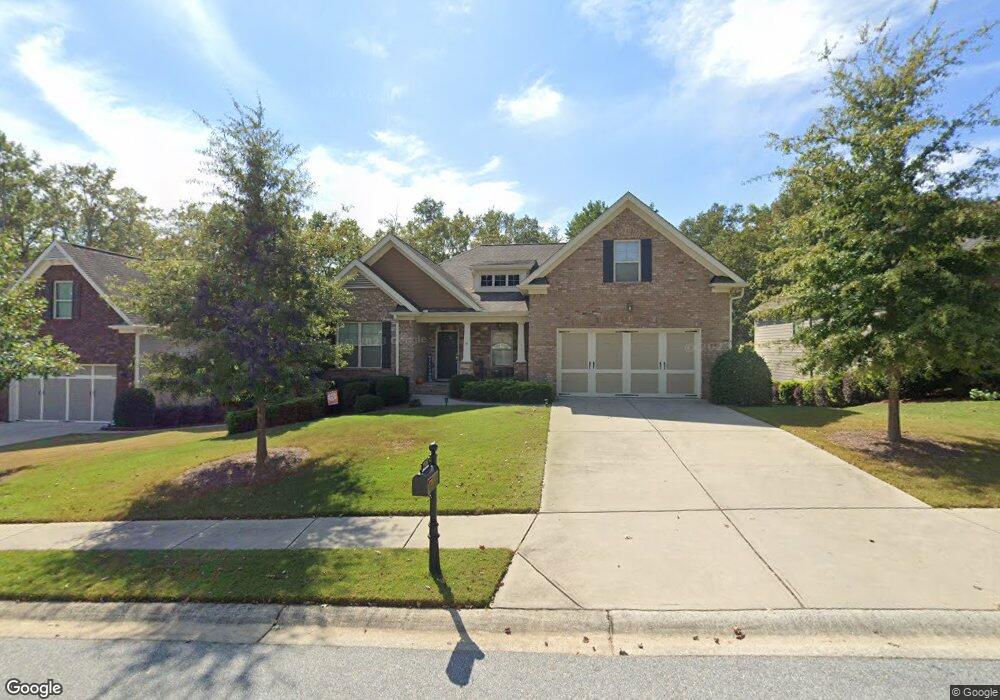
526 Butterfly Ln Unit 34 Braselton, GA 30517
Estimated Value: $501,487 - $590,000
4
Beds
4
Baths
3,111
Sq Ft
$176/Sq Ft
Est. Value
About This Home
This home is located at 526 Butterfly Ln Unit 34, Braselton, GA 30517 and is currently estimated at $548,122, approximately $176 per square foot. 526 Butterfly Ln Unit 34 is a home located in Jackson County with nearby schools including West Jackson Elementary School, West Jackson Middle School, and Jackson County High School.
Ownership History
Date
Name
Owned For
Owner Type
Purchase Details
Closed on
Sep 4, 2020
Sold by
Speer Mark
Bought by
Speer Mark and Speer Julie
Current Estimated Value
Purchase Details
Closed on
Sep 30, 2019
Sold by
Speer Melissa
Bought by
Speer Mark
Purchase Details
Closed on
Aug 12, 2016
Bought by
Speer Mark and Speer Melissa
Home Financials for this Owner
Home Financials are based on the most recent Mortgage that was taken out on this home.
Original Mortgage
$186,296
Interest Rate
3.42%
Mortgage Type
New Conventional
Purchase Details
Closed on
Jan 7, 2016
Sold by
Fairway Fund Xii Llc
Bought by
Acadia Homes Neighborhoods L
Purchase Details
Closed on
Mar 2, 2010
Sold by
Bts Properties Ii Llc
Bought by
Fairway Fund Xii Llc
Purchase Details
Closed on
Jun 15, 2005
Sold by
Braselton Ventures Llc
Bought by
Bts Properties Ii Llc
Create a Home Valuation Report for This Property
The Home Valuation Report is an in-depth analysis detailing your home's value as well as a comparison with similar homes in the area
Home Values in the Area
Average Home Value in this Area
Purchase History
| Date | Buyer | Sale Price | Title Company |
|---|---|---|---|
| Speer Mark | -- | -- | |
| Speer Mark | -- | -- | |
| Speer Mark | $386,296 | -- | |
| Acadia Homes Neighborhoods L | -- | -- | |
| Taylor Morrison Of Georgia Llc | $821,589 | -- | |
| Fairway Fund Xii Llc | -- | -- | |
| Bts Properties Ii Llc | $5,352,600 | -- |
Source: Public Records
Mortgage History
| Date | Status | Borrower | Loan Amount |
|---|---|---|---|
| Previous Owner | Speer Mark | $186,296 |
Source: Public Records
Tax History Compared to Growth
Tax History
| Year | Tax Paid | Tax Assessment Tax Assessment Total Assessment is a certain percentage of the fair market value that is determined by local assessors to be the total taxable value of land and additions on the property. | Land | Improvement |
|---|---|---|---|---|
| 2024 | $6,239 | $224,160 | $26,240 | $197,920 |
| 2023 | $6,300 | $200,520 | $26,240 | $174,280 |
| 2022 | $5,217 | $164,640 | $26,240 | $138,400 |
| 2021 | $5,264 | $164,640 | $26,240 | $138,400 |
| 2020 | $5,258 | $151,360 | $26,240 | $125,120 |
| 2019 | $5,905 | $166,800 | $26,240 | $140,560 |
| 2018 | $5,697 | $159,560 | $26,240 | $133,320 |
| 2017 | $5,146 | $143,242 | $26,240 | $117,002 |
| 2016 | $914 | $25,000 | $25,000 | $0 |
| 2015 | $440 | $12,000 | $12,000 | $0 |
| 2014 | $432 | $12,000 | $12,000 | $0 |
| 2013 | -- | $2,000 | $2,000 | $0 |
Source: Public Records
Map
Nearby Homes
- 549 Butterfly Ln
- 733 Brookfield Dr
- 1668 Jesse Cronic Ct
- 671 New Liberty Way
- 646 Baker View Ln
- 164 Bakers Farm Cir
- 13 Jocelyn Dr
- 345 Broadmoor Dr
- 162 Valimar Dr
- 1560 Kaden Ln
- 21 Traminer Way
- 1721 Landon Ln
- 5031 Adler Ct
- 4941 Adler Ct
- 2017 Yvette Way
- 1718 Landon Ln
- 2046 Yvette Way
- Hanover Plan at Braselton Village
- IRWIN II Plan at Braselton Village
- BELHAVEN Plan at Braselton Village
- 526 Butterfly Ln
- 518 Butterfly Ln
- 534 Butterfly Ln
- 506 Butterfly Ln
- 525 Butterfly Ln
- 490 Butterfly Ln Unit 37
- 490 Butterfly Ln
- 517 Butterfly Ln
- 533 Butterfly Ln
- 509 Butterfly Ln Unit 26
- 541 Butterfly Ln
- 484 Butterfly Ln
- 501 Butterfly Ln
- 820 Brookfield Dr
- 549 Butterfly Ln Unit 31
- 852 New Liberty Way
- 852 New Liberty Way
- 866 New Liberty Way
- 480 Butterfly Ln
- 838 New Liberty Way