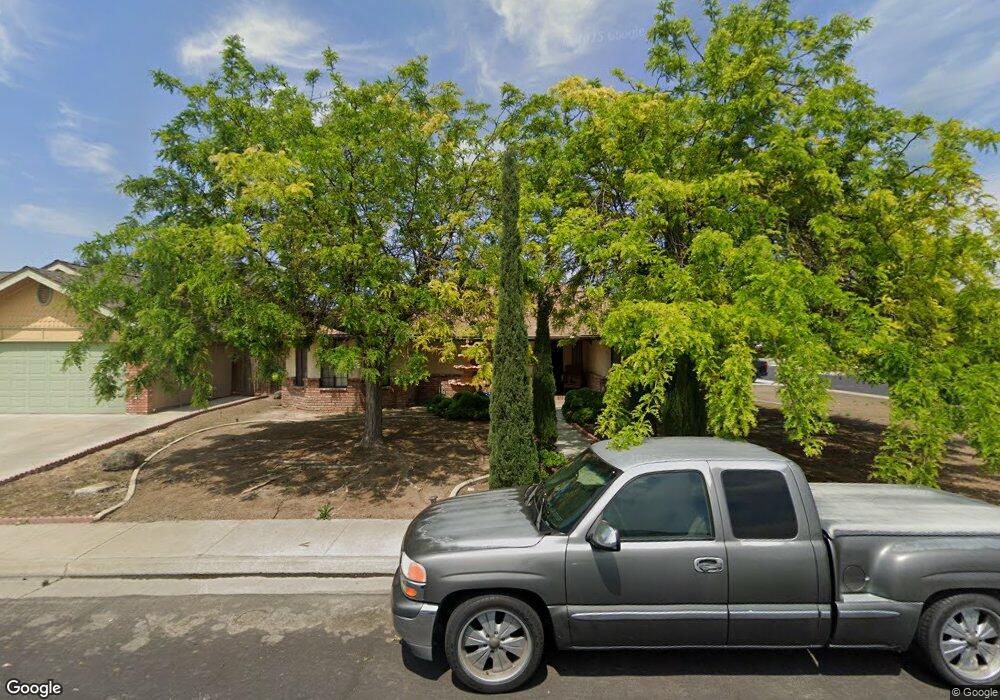
526 E Ash Ave Hanford, CA 93230
Estimated Value: $392,932 - $423,000
3
Beds
2
Baths
1,957
Sq Ft
$211/Sq Ft
Est. Value
About This Home
This home is located at 526 E Ash Ave, Hanford, CA 93230 and is currently estimated at $412,733, approximately $210 per square foot. 526 E Ash Ave is a home located in Kings County with nearby schools including George Washington Elementary School, John F. Kennedy Junior High School, and Hanford High School.
Ownership History
Date
Name
Owned For
Owner Type
Purchase Details
Closed on
Apr 28, 1998
Sold by
Park Margaret and Park Jacqueline
Bought by
Marroquin Jacob and Marroquin Sally
Current Estimated Value
Home Financials for this Owner
Home Financials are based on the most recent Mortgage that was taken out on this home.
Original Mortgage
$140,760
Outstanding Balance
$27,408
Interest Rate
7.06%
Mortgage Type
VA
Estimated Equity
$385,325
Create a Home Valuation Report for This Property
The Home Valuation Report is an in-depth analysis detailing your home's value as well as a comparison with similar homes in the area
Home Values in the Area
Average Home Value in this Area
Purchase History
| Date | Buyer | Sale Price | Title Company |
|---|---|---|---|
| Marroquin Jacob | $138,000 | Hanford Title Co |
Source: Public Records
Mortgage History
| Date | Status | Borrower | Loan Amount |
|---|---|---|---|
| Open | Marroquin Jacob | $140,760 |
Source: Public Records
Tax History
| Year | Tax Paid | Tax Assessment Tax Assessment Total Assessment is a certain percentage of the fair market value that is determined by local assessors to be the total taxable value of land and additions on the property. | Land | Improvement |
|---|---|---|---|---|
| 2025 | $2,263 | $220,356 | $47,903 | $172,453 |
| 2023 | $2,263 | $211,801 | $46,044 | $165,757 |
| 2022 | $2,213 | $207,649 | $45,142 | $162,507 |
| 2021 | $2,164 | $203,578 | $44,257 | $159,321 |
| 2020 | $2,186 | $201,490 | $43,803 | $157,687 |
| 2019 | $2,148 | $197,539 | $42,944 | $154,595 |
| 2018 | $2,085 | $193,666 | $42,102 | $151,564 |
| 2017 | $2,051 | $189,868 | $41,276 | $148,592 |
| 2016 | $2,023 | $186,145 | $40,467 | $145,678 |
| 2015 | $2,009 | $183,349 | $39,859 | $143,490 |
| 2014 | $1,968 | $179,757 | $39,078 | $140,679 |
Source: Public Records
Map
Nearby Homes
- 2301 N 10th Ave
- 2215 N Mayfair Dr
- 2403 Cherrywood Ct
- 2109 N Kensington Way
- 2335 N Douty St
- 120 W Magnolia Ave
- 950 Cedarwood St
- 2411 Cottonwood Dr
- 2083 Parker Place
- 982 Cedarwood St
- 2055 N Burl Dr
- 230 W Ash Ave
- 180 W Magnolia Ave
- 2202 Cottonwood Ct
- 2116 N Woodridge Way
- 2234 Carter Way
- 969 Lakewood Dr
- 1913 Stratford Way
- 2002 N Woodridge Way
- 1901 N Kensington Way
Your Personal Tour Guide
Ask me questions while you tour the home.