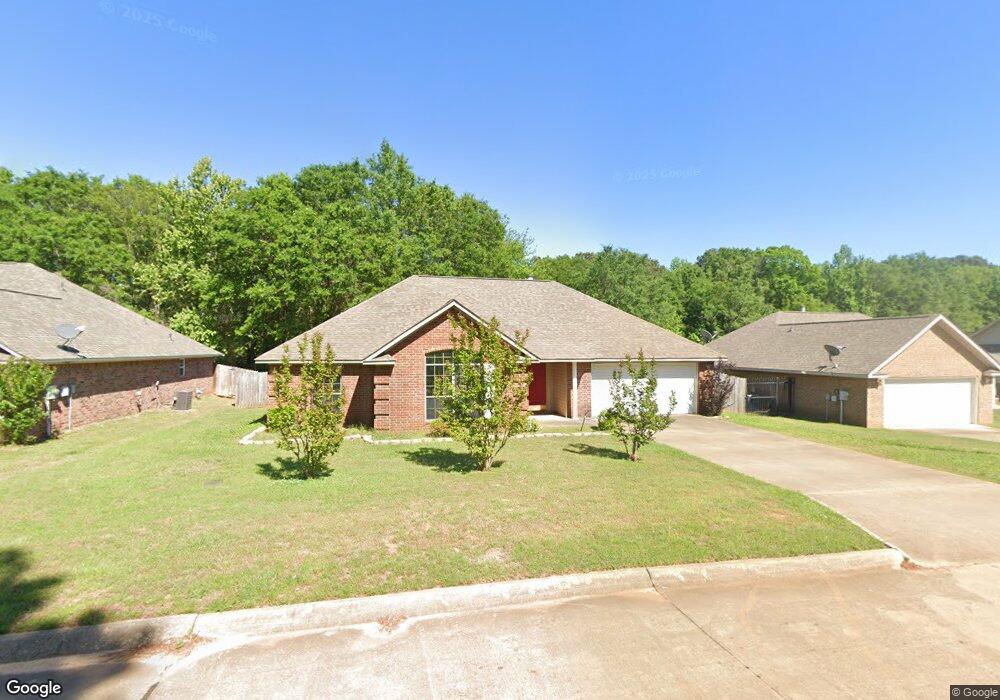
526 E Greenfield Dr Wake Village, TX 75501
Estimated Value: $202,732 - $249,000
3
Beds
2
Baths
1,432
Sq Ft
$156/Sq Ft
Est. Value
About This Home
This home is located at 526 E Greenfield Dr, Wake Village, TX 75501 and is currently estimated at $223,933, approximately $156 per square foot. 526 E Greenfield Dr is a home located in Bowie County with nearby schools including Wake Village Elementary School, Texas Middle School, and Texas High School.
Ownership History
Date
Name
Owned For
Owner Type
Purchase Details
Closed on
Mar 24, 2017
Sold by
Roy Calyse R Frierson and Roy Jon A
Bought by
Griffith Adrienne M
Current Estimated Value
Home Financials for this Owner
Home Financials are based on the most recent Mortgage that was taken out on this home.
Original Mortgage
$140,409
Outstanding Balance
$116,415
Interest Rate
4.25%
Mortgage Type
FHA
Estimated Equity
$107,518
Purchase Details
Closed on
Mar 16, 2015
Sold by
Roberts Gloria Jean and The Bobbie Jean Roberts Irrevo
Bought by
Frierson Calyse R
Purchase Details
Closed on
May 31, 2006
Sold by
Harris Stephen O
Bought by
J Carper Llp
Home Financials for this Owner
Home Financials are based on the most recent Mortgage that was taken out on this home.
Original Mortgage
$105,400
Interest Rate
6.5%
Mortgage Type
Future Advance Clause Open End Mortgage
Create a Home Valuation Report for This Property
The Home Valuation Report is an in-depth analysis detailing your home's value as well as a comparison with similar homes in the area
Home Values in the Area
Average Home Value in this Area
Purchase History
| Date | Buyer | Sale Price | Title Company |
|---|---|---|---|
| Griffith Adrienne M | -- | Stewart Title | |
| Frierson Calyse R | $135,107 | None Available | |
| J Carper Llp | -- | None Available |
Source: Public Records
Mortgage History
| Date | Status | Borrower | Loan Amount |
|---|---|---|---|
| Open | Griffith Adrienne M | $140,409 | |
| Previous Owner | J Carper Llp | $105,400 |
Source: Public Records
Tax History Compared to Growth
Tax History
| Year | Tax Paid | Tax Assessment Tax Assessment Total Assessment is a certain percentage of the fair market value that is determined by local assessors to be the total taxable value of land and additions on the property. | Land | Improvement |
|---|---|---|---|---|
| 2025 | $3,033 | $231,325 | $20,000 | $211,325 |
| 2024 | $3,033 | $219,207 | $18,000 | $206,688 |
| 2023 | $4,021 | $199,279 | $0 | $0 |
| 2022 | $3,722 | $193,696 | $18,000 | $175,696 |
| 2021 | $3,649 | $164,694 | $18,000 | $146,694 |
| 2020 | $3,524 | $158,062 | $18,000 | $140,062 |
| 2019 | $3,530 | $151,738 | $18,000 | $133,738 |
| 2018 | $3,416 | $146,864 | $18,000 | $128,864 |
| 2017 | $3,040 | $131,114 | $18,000 | $113,114 |
| 2016 | $2,966 | $127,899 | $18,000 | $109,899 |
| 2015 | $1,010 | $126,828 | $18,000 | $108,828 |
| 2014 | $1,010 | $125,791 | $18,000 | $107,791 |
Source: Public Records
Map
Nearby Homes
- 110 Village Place
- 117 Village Place
- 119 Village Place
- 115 Village Place
- 113 Village Place
- 1018 Brown Dr
- 448 E Greenfield Dr
- 41 Williams Cir
- LOTS Hawkins
- 33 Williams Cir
- 702 Hawkins Ave
- 813 Elaine Dr
- 720 Diane Dr
- 814 Elaine Dr
- 741 Macarthur Ave
- 720 Macarthur Ave
- 810 Hawkins Ave
- 504 Redwater Rd
- 826 Redwater Rd
- 613 Arizona Ave
- 528 E Greenfield Dr
- 524 E Greenfield Dr
- 530 E Greenfield Dr
- 523 E Greenfield Dr
- 521 E Greenfield Dr
- 525 E Greenfield Dr
- 520 E Greenfield Dr
- 519 E Greenfield Dr
- 527 E Greenfield Dr
- 517 E Greenfield Dr
- 518 E Greenfield Dr
- 515 E Greenfield Dr
- 106 Village Place
- 102 Village Place
- 104 Village Place
- 516 E Greenfield Dr
- 514 E Greenfield Dr
- 414 Cavite Place
- 412 Cavite Place
- 410 Cavite Place