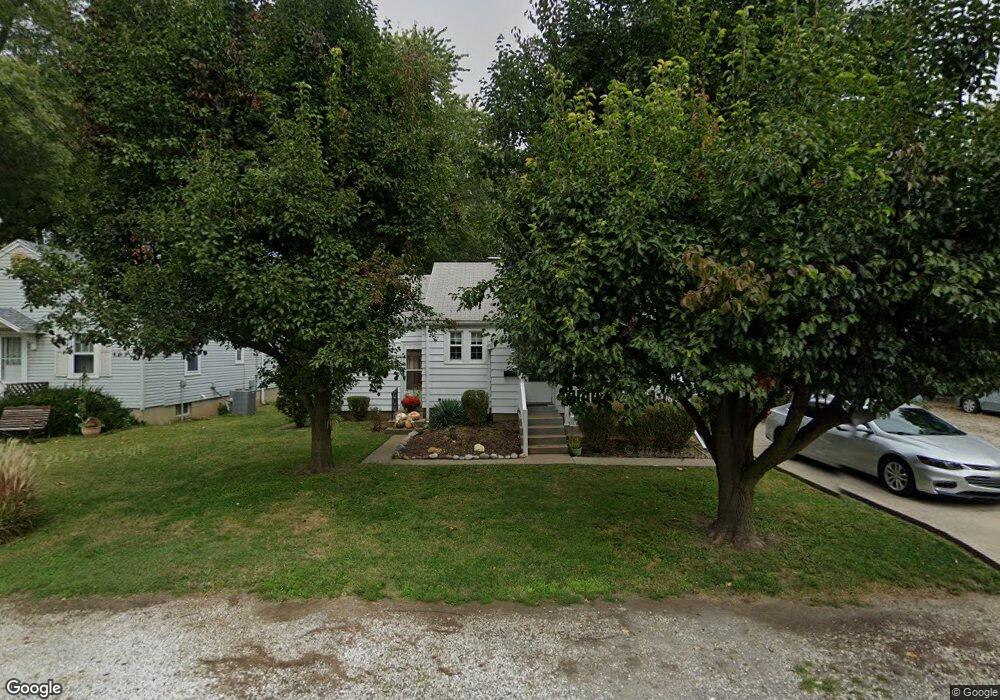
526 Henry St Jacksonville, IL 62650
Estimated Value: $72,000 - $81,655
--
Bed
--
Bath
776
Sq Ft
$99/Sq Ft
Est. Value
About This Home
This home is located at 526 Henry St, Jacksonville, IL 62650 and is currently estimated at $76,914, approximately $99 per square foot. 526 Henry St is a home located in Morgan County with nearby schools including Jacksonville High School, Salem Lutheran School, and Salem Lutheran School.
Ownership History
Date
Name
Owned For
Owner Type
Purchase Details
Closed on
Aug 20, 2025
Sold by
Boulanger Terryl and Boulanger Lonnie
Bought by
Parc Brook Investments Llc
Current Estimated Value
Purchase Details
Closed on
Oct 25, 2006
Sold by
Crouse Christopher T
Bought by
Boulanger Lonnie D and Boulanger Terry J
Home Financials for this Owner
Home Financials are based on the most recent Mortgage that was taken out on this home.
Original Mortgage
$50,000
Interest Rate
6.5%
Mortgage Type
New Conventional
Create a Home Valuation Report for This Property
The Home Valuation Report is an in-depth analysis detailing your home's value as well as a comparison with similar homes in the area
Home Values in the Area
Average Home Value in this Area
Purchase History
| Date | Buyer | Sale Price | Title Company |
|---|---|---|---|
| Parc Brook Investments Llc | -- | None Listed On Document | |
| Boulanger Lonnie D | $15,667 | None Available |
Source: Public Records
Mortgage History
| Date | Status | Borrower | Loan Amount |
|---|---|---|---|
| Previous Owner | Boulanger Lonnie D | $50,000 |
Source: Public Records
Tax History Compared to Growth
Tax History
| Year | Tax Paid | Tax Assessment Tax Assessment Total Assessment is a certain percentage of the fair market value that is determined by local assessors to be the total taxable value of land and additions on the property. | Land | Improvement |
|---|---|---|---|---|
| 2024 | $1,445 | $16,600 | $1,440 | $15,160 |
| 2023 | $1,469 | $15,580 | $1,440 | $14,140 |
| 2022 | $1,598 | $16,770 | $1,440 | $15,330 |
| 2021 | $1,577 | $16,910 | $1,710 | $15,200 |
| 2020 | $1,609 | $16,910 | $1,710 | $15,200 |
| 2019 | $1,598 | $16,910 | $1,710 | $15,200 |
| 2018 | $1,541 | $16,910 | $1,710 | $15,200 |
| 2017 | $1,578 | $17,710 | $1,710 | $16,000 |
| 2016 | $1,595 | $17,710 | $1,710 | $16,000 |
| 2015 | $1,575 | $17,190 | $1,660 | $15,530 |
| 2014 | $1,575 | $17,190 | $1,660 | $15,530 |
| 2013 | $1,486 | $17,190 | $1,660 | $15,530 |
Source: Public Records
Map
Nearby Homes
- 727 Hardin Ave
- 544 Hardin Ave
- 333 Kentucky St
- 352 Franklin St
- 900 Bibbs St
- 800 S Main St
- 406 S East St
- 401 S East St
- 209 E Beecher Ave
- 440 S Sandy St
- 227 Anna St
- 203 W Beecher Ave
- 306 E Michigan Ave
- 697 E State St
- 107 E Michigan Ave
- 1509 Hardin Ave
- None None St
- 1434 S East St
- 216 S Church St
- 400 W Morgan St