Estimated Value: $189,000 - $303,129
4
Beds
1
Bath
4,513
Sq Ft
$55/Sq Ft
Est. Value
About This Home
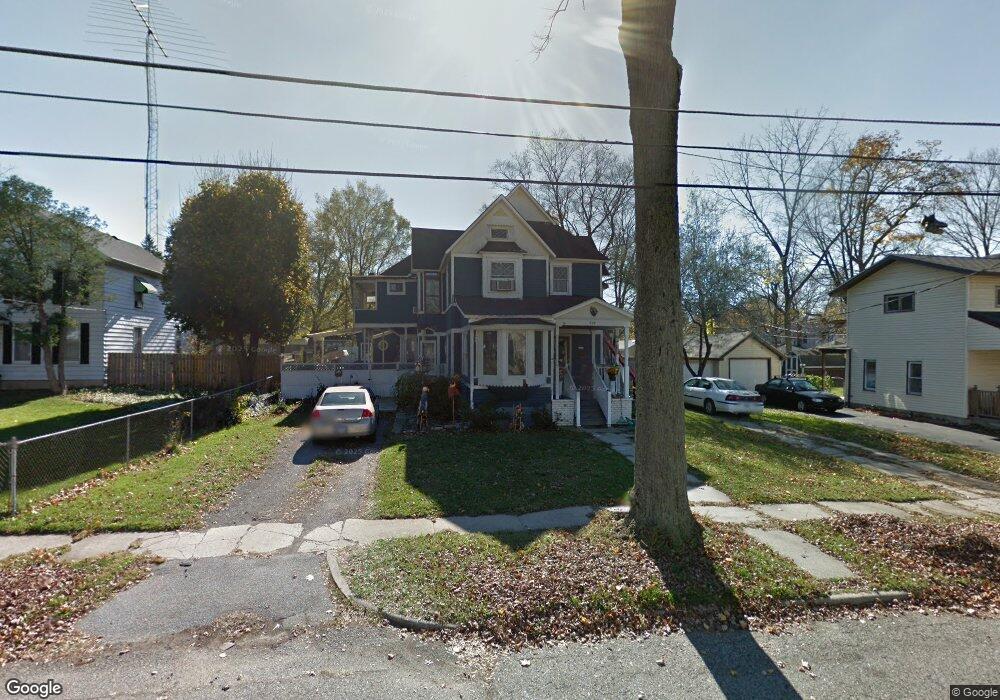
This home is located at 526 Hickory St, Niles, MI 49120 and is currently estimated at $246,782, approximately $54 per square foot. 526 Hickory St is a home with nearby schools including Ballard Elementary School, Oak Manor Sixth Grade Center, and Ring Lardner Middle School.
Ownership History
Date
Name
Owned For
Owner Type
Purchase Details
Closed on
Sep 22, 2003
Sold by
Pierce Walter A
Bought by
Pierce Sharon
Current Estimated Value
Purchase Details
Closed on
Oct 29, 1990
Purchase Details
Closed on
Jul 18, 1987
Purchase Details
Closed on
Nov 26, 1986
Purchase Details
Closed on
Sep 16, 1986
Purchase Details
Closed on
Jan 20, 1986
Purchase Details
Closed on
Jun 1, 1983
Purchase Details
Closed on
Apr 29, 1983
Purchase Details
Closed on
Mar 23, 1978
Create a Home Valuation Report for This Property
The Home Valuation Report is an in-depth analysis detailing your home's value as well as a comparison with similar homes in the area
Home Values in the Area
Average Home Value in this Area
Purchase History
| Date | Buyer | Sale Price | Title Company |
|---|---|---|---|
| Pierce Sharon | $500 | -- | |
| -- | $100 | -- | |
| -- | $10,000 | -- | |
| -- | $12,000 | -- | |
| -- | $32,500 | -- | |
| -- | -- | -- | |
| -- | -- | -- | |
| -- | -- | -- | |
| -- | -- | -- |
Source: Public Records
Tax History Compared to Growth
Tax History
| Year | Tax Paid | Tax Assessment Tax Assessment Total Assessment is a certain percentage of the fair market value that is determined by local assessors to be the total taxable value of land and additions on the property. | Land | Improvement |
|---|---|---|---|---|
| 2025 | $1,200 | $154,900 | $0 | $0 |
| 2024 | $584 | $132,800 | $0 | $0 |
| 2023 | $560 | $88,900 | $0 | $0 |
| 2022 | $533 | $81,600 | $0 | $0 |
| 2021 | $1,017 | $76,100 | $4,700 | $71,400 |
| 2020 | $1,006 | $58,700 | $0 | $0 |
| 2019 | $992 | $31,600 | $12,800 | $18,800 |
| 2018 | $957 | $31,600 | $0 | $0 |
| 2017 | $947 | $22,400 | $0 | $0 |
| 2016 | $932 | $20,800 | $0 | $0 |
| 2015 | $929 | $19,900 | $0 | $0 |
| 2014 | $463 | $19,600 | $0 | $0 |
Source: Public Records
Map
Nearby Homes
- 211 S 4th St
- 712 Maple St
- 319 S 5th St
- 709 Regent St
- 921 Cedar St
- VL Huron St
- 211 N 8th St
- 923 Regent St
- 314 N 6th St
- 1121 Broadway St
- 810 Ferry St
- 321 S 13th St
- 1648 Oak St
- 211 S Street Joseph Ave
- 413 S Street Joseph Ave
- 1314 Ferry St
- 1123 N 9th St
- 124 S State St
- Integrity 1610 Plan at Carefree Villas
- Integrity 1605 Plan at Carefree Villas