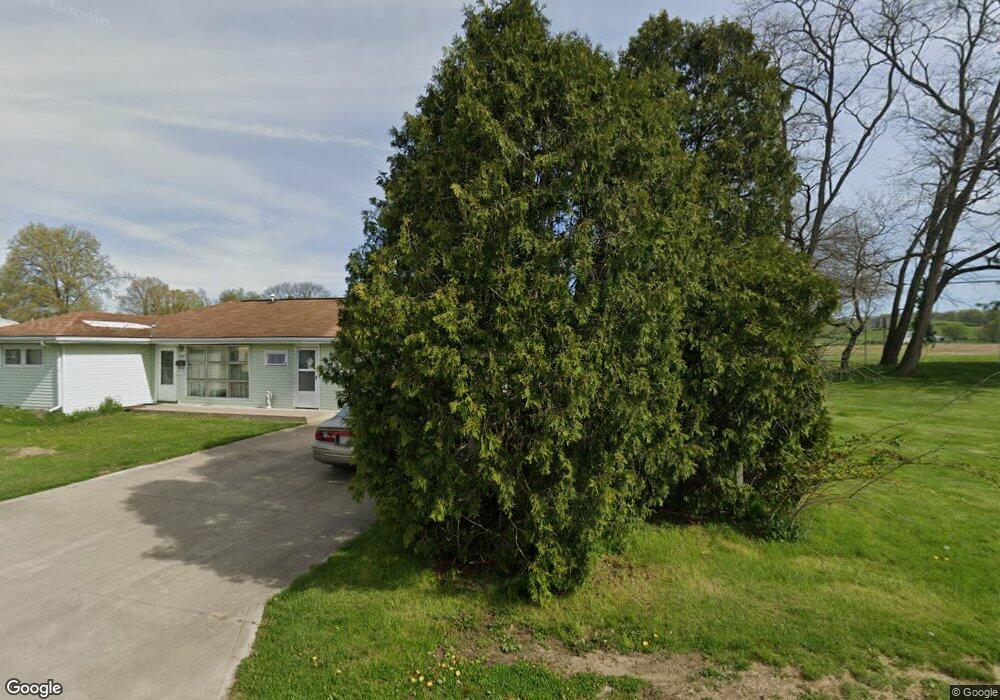
526 Lexington Ave Newark, OH 43055
Estimated Value: $177,000 - $201,657
3
Beds
1
Bath
984
Sq Ft
$196/Sq Ft
Est. Value
About This Home
This home is located at 526 Lexington Ave, Newark, OH 43055 and is currently estimated at $193,164, approximately $196 per square foot. 526 Lexington Ave is a home located in Licking County with nearby schools including Carson Elementary School, Heritage Middle School, and Newark High School.
Ownership History
Date
Name
Owned For
Owner Type
Purchase Details
Closed on
Apr 13, 2006
Sold by
Linton Camilla K and Haynes Brandon T
Bought by
Corsi Lynn F and Decker Ella Mae
Current Estimated Value
Home Financials for this Owner
Home Financials are based on the most recent Mortgage that was taken out on this home.
Original Mortgage
$84,671
Outstanding Balance
$48,601
Interest Rate
6.34%
Mortgage Type
FHA
Estimated Equity
$144,563
Purchase Details
Closed on
Jul 15, 2005
Sold by
Ramsey Roy G and Ramsey Nellie Ann
Bought by
Linton Camilla K and Haynes Brandon T
Home Financials for this Owner
Home Financials are based on the most recent Mortgage that was taken out on this home.
Original Mortgage
$59,200
Interest Rate
5.69%
Mortgage Type
Fannie Mae Freddie Mac
Purchase Details
Closed on
Jul 14, 1995
Sold by
Sayer Joe
Bought by
Ramsey Roy G and Ramsey Nellie A
Home Financials for this Owner
Home Financials are based on the most recent Mortgage that was taken out on this home.
Original Mortgage
$47,838
Interest Rate
7.79%
Mortgage Type
VA
Create a Home Valuation Report for This Property
The Home Valuation Report is an in-depth analysis detailing your home's value as well as a comparison with similar homes in the area
Home Values in the Area
Average Home Value in this Area
Purchase History
| Date | Buyer | Sale Price | Title Company |
|---|---|---|---|
| Corsi Lynn F | $86,000 | Ambassad | |
| Linton Camilla K | $74,000 | -- | |
| Ramsey Roy G | $46,900 | -- |
Source: Public Records
Mortgage History
| Date | Status | Borrower | Loan Amount |
|---|---|---|---|
| Open | Corsi Lynn F | $84,671 | |
| Previous Owner | Linton Camilla K | $59,200 | |
| Previous Owner | Ramsey Roy G | $47,838 |
Source: Public Records
Tax History Compared to Growth
Tax History
| Year | Tax Paid | Tax Assessment Tax Assessment Total Assessment is a certain percentage of the fair market value that is determined by local assessors to be the total taxable value of land and additions on the property. | Land | Improvement |
|---|---|---|---|---|
| 2024 | $1,833 | $51,310 | $11,900 | $39,410 |
| 2023 | $1,832 | $51,310 | $11,900 | $39,410 |
| 2022 | $1,406 | $35,010 | $7,740 | $27,270 |
| 2021 | $1,474 | $35,010 | $7,740 | $27,270 |
| 2020 | $1,508 | $35,010 | $7,740 | $27,270 |
| 2019 | $1,205 | $26,920 | $5,950 | $20,970 |
| 2018 | $1,206 | $0 | $0 | $0 |
| 2017 | $1,288 | $0 | $0 | $0 |
| 2016 | $1,391 | $0 | $0 | $0 |
| 2015 | $1,421 | $0 | $0 | $0 |
| 2014 | $1,820 | $0 | $0 | $0 |
| 2013 | $1,346 | $0 | $0 | $0 |
Source: Public Records
Map
Nearby Homes
- 506 Lexington Ave
- 483 Allston Ave
- 460 Allston Ave
- 424 Ridge Ave
- 554 Garfield Ave
- 491 Garfield Ave
- 240 N Wing St
- 167 Essex St
- 160 N Cedar St
- 408 Cedarcrest Ave
- 688 Russell Ave
- 81 Madison Ave
- 76 Oakwood Ave
- 204 Hunter St
- 934 Garfield Ave
- 136 Hunter St
- 284 Everett Ave
- 165 Edwards St
- 430 E Main St
- 87 Liberty Ave
- 516 Lexington Ave
- 531 New Haven Ct
- 510 Lexington Ave
- 475 New Haven Ave
- 533 New Haven Ct
- 527 Lexington Ave
- 521 Lexington Ave
- 515 Lexington Ave
- 481 New Haven Ave
- 535 New Haven Ct
- 498 Lexington Ave
- 509 Lexington Ave
- 480 New Haven Ave
- 537 New Haven Ct
- 553 New Haven Ct
- 495 Lexington Ave
- 551 New Haven Ct
- 480 Lexington Ave
- 478 New Haven Ave
- 520 Allston Ave