Estimated Value: $8,949,412
--
Bed
2
Baths
8,222
Sq Ft
$1,088/Sq Ft
Est. Value
About This Home
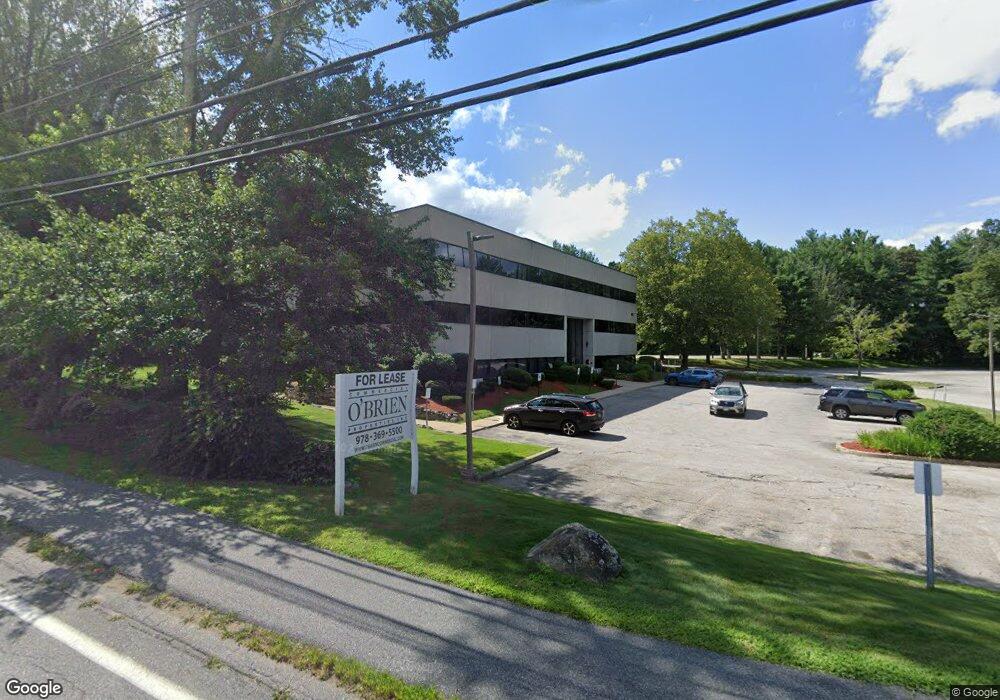
This home is located at 526 Main St, Acton, MA 01720 and is currently estimated at $8,949,412, approximately $1,088 per square foot. 526 Main St is a home located in Middlesex County with nearby schools including Acton-Boxborough Regional High School and Oak Meadow Montessori School.
Ownership History
Date
Name
Owned For
Owner Type
Purchase Details
Closed on
Jun 3, 2008
Sold by
Third Acton Llc
Bought by
Mig Acton Llc
Current Estimated Value
Home Financials for this Owner
Home Financials are based on the most recent Mortgage that was taken out on this home.
Original Mortgage
$3,150,000
Outstanding Balance
$2,006,828
Interest Rate
5.91%
Mortgage Type
Commercial
Estimated Equity
$6,942,584
Create a Home Valuation Report for This Property
The Home Valuation Report is an in-depth analysis detailing your home's value as well as a comparison with similar homes in the area
Home Values in the Area
Average Home Value in this Area
Purchase History
| Date | Buyer | Sale Price | Title Company |
|---|---|---|---|
| Mig Acton Llc | $4,111,500 | -- |
Source: Public Records
Mortgage History
| Date | Status | Borrower | Loan Amount |
|---|---|---|---|
| Open | Mig Acton Llc | $3,150,000 |
Source: Public Records
Tax History Compared to Growth
Tax History
| Year | Tax Paid | Tax Assessment Tax Assessment Total Assessment is a certain percentage of the fair market value that is determined by local assessors to be the total taxable value of land and additions on the property. | Land | Improvement |
|---|---|---|---|---|
| 2025 | $51,347 | $2,994,000 | $1,874,800 | $1,119,200 |
| 2024 | $49,320 | $2,958,600 | $1,874,800 | $1,083,800 |
| 2023 | $48,567 | $2,765,800 | $1,705,600 | $1,060,200 |
| 2022 | $55,574 | $2,857,300 | $1,482,500 | $1,374,800 |
| 2021 | $56,840 | $2,809,700 | $1,372,100 | $1,437,600 |
| 2020 | $54,059 | $2,809,700 | $1,372,100 | $1,437,600 |
| 2019 | $53,488 | $2,761,400 | $1,372,100 | $1,389,300 |
| 2018 | $52,896 | $2,729,400 | $1,372,100 | $1,357,300 |
| 2017 | $53,153 | $2,788,700 | $1,372,100 | $1,416,600 |
| 2016 | $53,300 | $2,771,700 | $1,372,100 | $1,399,600 |
| 2015 | $49,922 | $2,620,600 | $1,372,100 | $1,248,500 |
| 2014 | $52,494 | $2,698,900 | $1,372,100 | $1,326,800 |
Source: Public Records
Map
Nearby Homes
- 709 Main St
- 524 Main St
- 491 Main St
- 209 Great Rd Unit C1
- 23 John Swift Rd
- 16 Wampus Ave Unit 32
- 10 Blue Heron Way Unit 10
- 10 Blue Heron Way
- 7 Blue Heron Way
- 37 Hosmer St
- 6 Bittersweet Ln
- 11 Horseshoe Dr
- 386 Great Rd Unit A8
- 134 Pope Rd
- 159 Skyline Dr Unit 159
- 1 Bayberry Rd
- 420 Great Rd Unit B3
- 403 Great Rd Unit 5
- 407 Great Rd Unit 9
- 10 Wingate Ln
- 1 Acton Place
- 350 Main St
- 1012 Main St
- 0 Main St Unit 72751826
- 9999 Main St
- 99999 Main St
- 531 Main St
- 525 Main St Unit NEW
- 525 Main St
- 525 Main St Unit a
- 525 Main St Unit B
- 3 Franklin Place
- 10 Franklin Place
- 10 Franklin Place Unit 10
- 1 Franklin Place
- 5 Franklin Place
- 7 Franklin Place
- 9 Franklin Place
- 11 Franklin Place
- 12 Franklin Place