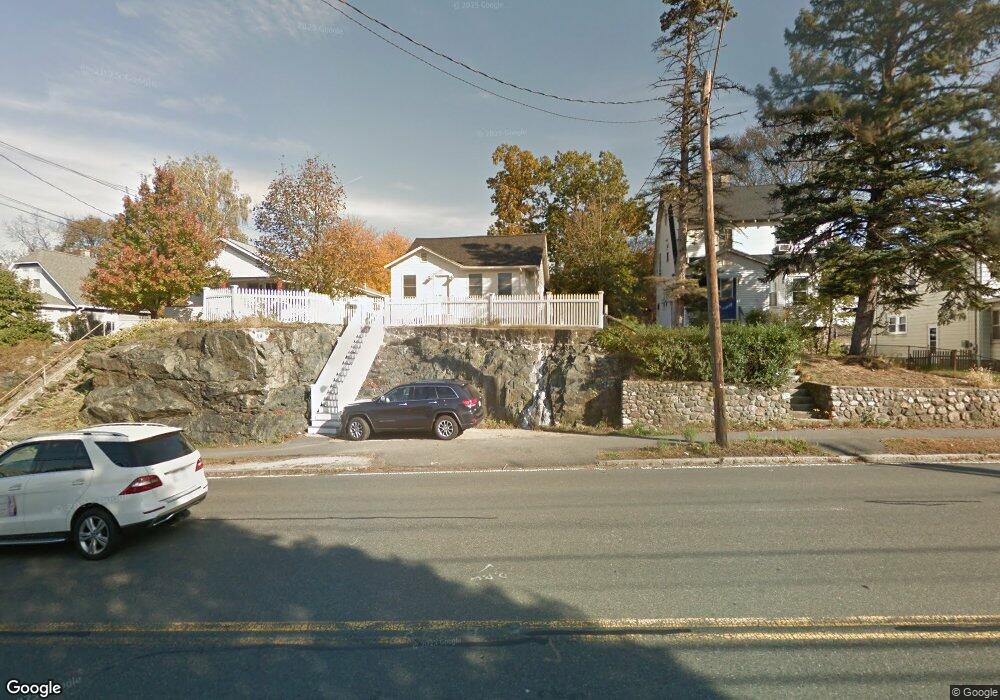
526 Main St Stoneham, MA 02180
Haywardville NeighborhoodEstimated Value: $614,000 - $661,000
2
Beds
1
Bath
1,092
Sq Ft
$578/Sq Ft
Est. Value
About This Home
This home is located at 526 Main St, Stoneham, MA 02180 and is currently estimated at $631,041, approximately $577 per square foot. 526 Main St is a home located in Middlesex County with nearby schools including Stoneham High School, Greater Boston Academy, and St. Patrick Elementary School.
Ownership History
Date
Name
Owned For
Owner Type
Purchase Details
Closed on
Mar 12, 2025
Sold by
Puglia Stephen G
Bought by
Puglia Ft and Puglia
Current Estimated Value
Purchase Details
Closed on
Apr 30, 1984
Bought by
Puglia Stephen G and Puglia Nancy E
Create a Home Valuation Report for This Property
The Home Valuation Report is an in-depth analysis detailing your home's value as well as a comparison with similar homes in the area
Home Values in the Area
Average Home Value in this Area
Purchase History
| Date | Buyer | Sale Price | Title Company |
|---|---|---|---|
| Puglia Ft | -- | None Available | |
| Puglia Stephen G | $71,900 | -- |
Source: Public Records
Mortgage History
| Date | Status | Borrower | Loan Amount |
|---|---|---|---|
| Previous Owner | Puglia Stephen G | $156,800 | |
| Previous Owner | Puglia Stephen G | $25,000 | |
| Previous Owner | Puglia Stephen G | $90,000 | |
| Previous Owner | Puglia Stephen G | $14,000 |
Source: Public Records
Tax History Compared to Growth
Tax History
| Year | Tax Paid | Tax Assessment Tax Assessment Total Assessment is a certain percentage of the fair market value that is determined by local assessors to be the total taxable value of land and additions on the property. | Land | Improvement |
|---|---|---|---|---|
| 2025 | $5,198 | $508,100 | $331,200 | $176,900 |
| 2024 | $5,068 | $478,600 | $305,000 | $173,600 |
| 2023 | $5,023 | $452,500 | $278,900 | $173,600 |
| 2022 | $4,334 | $416,300 | $252,700 | $163,600 |
| 2021 | $4,068 | $376,000 | $217,900 | $158,100 |
| 2020 | $3,956 | $366,600 | $205,400 | $161,200 |
| 2019 | $4,176 | $372,200 | $195,200 | $177,000 |
| 2018 | $4,056 | $346,400 | $188,300 | $158,100 |
| 2017 | $3,945 | $318,400 | $164,900 | $153,500 |
| 2016 | $3,486 | $274,500 | $164,900 | $109,600 |
| 2015 | $3,245 | $250,400 | $148,400 | $102,000 |
| 2014 | $3,271 | $242,500 | $131,900 | $110,600 |
Source: Public Records
Map
Nearby Homes
- 34 Warren St Unit 3
- 11 Congress St
- 8 Walnut St
- 25 Murdoch Rd
- 588 Main St Unit 3C
- 222 Park St
- 5 Rockville Park
- 5-9 Rockville Park
- 27 Emerson St Unit 27
- 17A 17 B Emerson
- 17 Emerson St Unit A
- 137 Franklin St Unit 102
- 137 Franklin St Unit 404
- 17 Franklin St
- 159 Franklin St Unit C2
- 2 Stratton Dr Unit 1109
- 2 Archer Dr Unit 1
- 12 Cottage St
- 10 Pomeworth St Unit H
- 43 Pomeworth St Unit 44