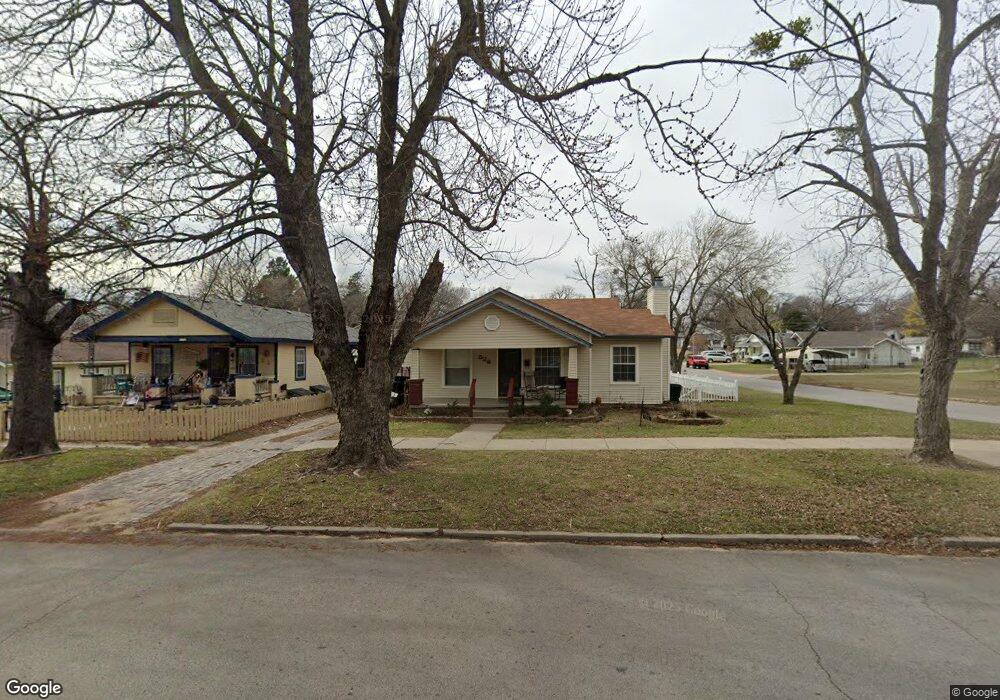
526 N Main St Sand Springs, OK 74063
Estimated Value: $141,000 - $198,000
--
Bed
1
Bath
1,662
Sq Ft
$102/Sq Ft
Est. Value
About This Home
This home is located at 526 N Main St, Sand Springs, OK 74063 and is currently estimated at $168,818, approximately $101 per square foot. 526 N Main St is a home located in Tulsa County with nearby schools including Garfield STEAM Academy, Northwoods Fine Arts Academy, and Clyde Boyd Middle School.
Ownership History
Date
Name
Owned For
Owner Type
Purchase Details
Closed on
Aug 19, 2019
Sold by
Bush Theodore Gene
Bought by
Bush Theodore Gene and Bush Stephanie Suzanne
Current Estimated Value
Purchase Details
Closed on
Nov 26, 2012
Sold by
Sharp Jesse Garland and Sharp Lovell L
Bought by
Sharp Lovell L and Foote Judith Ann
Purchase Details
Closed on
Aug 17, 2007
Sold by
Hud
Bought by
Bush Theodore Gene and Bush Lola Frances
Home Financials for this Owner
Home Financials are based on the most recent Mortgage that was taken out on this home.
Original Mortgage
$65,000
Interest Rate
6.69%
Mortgage Type
New Conventional
Purchase Details
Closed on
Jul 27, 1999
Sold by
Smith Tonya Renae and Smith Thomas
Bought by
Bland Douglas B and Bland Lana
Home Financials for this Owner
Home Financials are based on the most recent Mortgage that was taken out on this home.
Original Mortgage
$84,918
Interest Rate
7.71%
Mortgage Type
FHA
Purchase Details
Closed on
Jan 1, 1987
Create a Home Valuation Report for This Property
The Home Valuation Report is an in-depth analysis detailing your home's value as well as a comparison with similar homes in the area
Home Values in the Area
Average Home Value in this Area
Purchase History
| Date | Buyer | Sale Price | Title Company |
|---|---|---|---|
| Bush Theodore Gene | -- | None Available | |
| Sharp Lovell L | -- | None Available | |
| Bush Theodore Gene | -- | First American Title | |
| Bland Douglas B | $85,000 | -- | |
| -- | $24,000 | -- |
Source: Public Records
Mortgage History
| Date | Status | Borrower | Loan Amount |
|---|---|---|---|
| Previous Owner | Bush Theodore Gene | $65,000 | |
| Previous Owner | Bland Douglas B | $84,918 |
Source: Public Records
Tax History Compared to Growth
Tax History
| Year | Tax Paid | Tax Assessment Tax Assessment Total Assessment is a certain percentage of the fair market value that is determined by local assessors to be the total taxable value of land and additions on the property. | Land | Improvement |
|---|---|---|---|---|
| 2024 | $1,126 | $9,217 | $1,048 | $8,169 |
| 2023 | $1,126 | $9,919 | $1,128 | $8,791 |
| 2022 | $1,065 | $8,630 | $1,178 | $7,452 |
| 2021 | $1,047 | $8,350 | $1,140 | $7,210 |
| 2020 | $1,085 | $8,350 | $1,140 | $7,210 |
| 2019 | $1,054 | $8,350 | $1,140 | $7,210 |
| 2018 | $1,027 | $8,350 | $1,140 | $7,210 |
| 2017 | $1,006 | $9,350 | $1,276 | $8,074 |
| 2016 | $1,027 | $9,350 | $1,276 | $8,074 |
| 2015 | $1,042 | $9,350 | $1,276 | $8,074 |
| 2014 | $1,051 | $9,350 | $1,276 | $8,074 |
Source: Public Records
Map
Nearby Homes
- 513 N Main St
- 610 N Garfield Ave
- 608 N Mckinley Ave
- 523 N Roosevelt Ave
- 515 N Roosevelt Ave
- 608 N Roosevelt Ave
- 411 N Roosevelt Ave
- 4 S 265th West Ave
- 3 S 265th West Ave
- 907 N Wilson Ave
- 0 N Franklin Ave
- 518 N Franklin Ave
- 600 N Franklin Ave
- 214 N Wilson
- 1015 N Main St
- 306 N Grant Ave
- 416 N Franklin Ave
- 820 N Grant Ave
- 917 N Grant Ave
- 1015 N Cleveland Ave
- 524 N Main St
- 522 N Main St
- 600 N Main St
- 518 N Main St
- 523 N Garfield Ave
- 521 N Garfield Ave
- 604 N Main St
- 519 N Garfield Ave
- 514 N Main St
- 17 W 6th St
- 515 N Garfield Ave
- 519 N Main St
- 606 N Main St
- 512 N Main St
- 517 N Main St
- 515 N Main St
- 19 W 6th St
- 601 N Main St
- 509 N Garfield Ave
- 608 N Main St