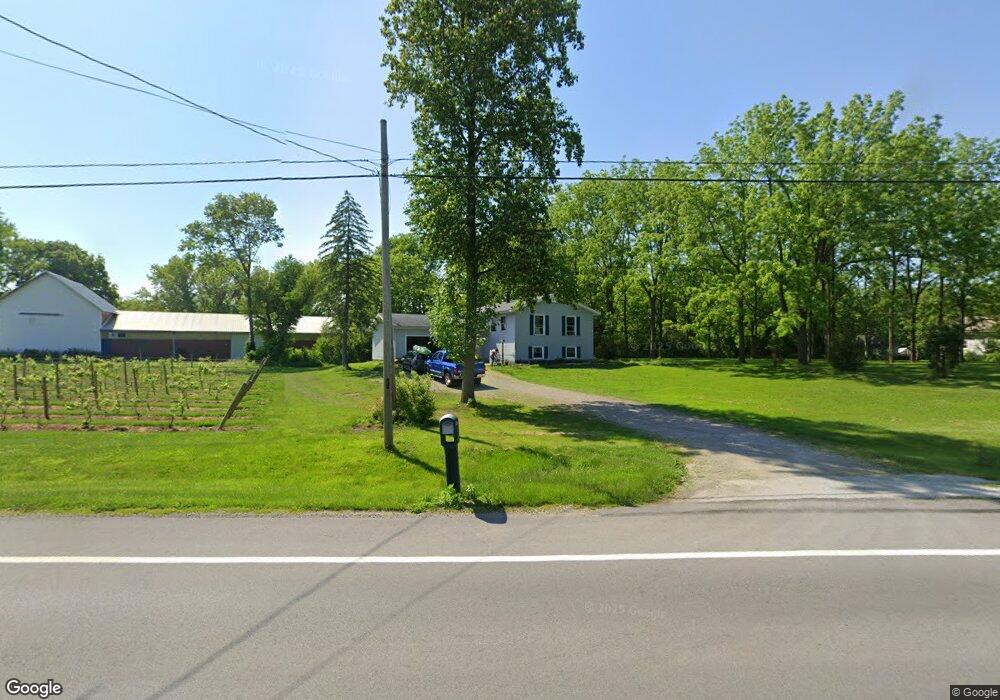
526 NE Catawba Rd Port Clinton, OH 43452
Estimated Value: $232,000 - $567,000
3
Beds
3
Baths
2,036
Sq Ft
$204/Sq Ft
Est. Value
About This Home
This home is located at 526 NE Catawba Rd, Port Clinton, OH 43452 and is currently estimated at $415,386, approximately $204 per square foot. 526 NE Catawba Rd is a home located in Ottawa County with nearby schools including Bataan Memorial Primary School, Bataan Memorial Intermediate School, and Port Clinton Middle School.
Ownership History
Date
Name
Owned For
Owner Type
Purchase Details
Closed on
Jun 10, 2019
Sold by
Hekron Investments Inc
Bought by
Quinterprise Llc
Current Estimated Value
Purchase Details
Closed on
Aug 15, 2016
Sold by
Barlow Daniel A and Barlow Debra D
Bought by
Hekron Investments Inc
Purchase Details
Closed on
Apr 14, 2009
Sold by
Barlow Daniel A and Barlow Debra D
Bought by
Barlow Daniel A and Barlow Debra D
Home Financials for this Owner
Home Financials are based on the most recent Mortgage that was taken out on this home.
Original Mortgage
$116,500
Interest Rate
5.19%
Mortgage Type
New Conventional
Purchase Details
Closed on
Dec 27, 1996
Sold by
Reiterman David T
Bought by
Barlow Daniel A and Barlow Debra A
Home Financials for this Owner
Home Financials are based on the most recent Mortgage that was taken out on this home.
Original Mortgage
$90,250
Interest Rate
7.88%
Mortgage Type
New Conventional
Create a Home Valuation Report for This Property
The Home Valuation Report is an in-depth analysis detailing your home's value as well as a comparison with similar homes in the area
Home Values in the Area
Average Home Value in this Area
Purchase History
| Date | Buyer | Sale Price | Title Company |
|---|---|---|---|
| Quinterprise Llc | $133,700 | Hartung Title Order | |
| Hekron Investments Inc | $160,000 | Hartung Title | |
| Barlow Daniel A | -- | None Available | |
| Barlow Daniel A | $90,000 | -- |
Source: Public Records
Mortgage History
| Date | Status | Borrower | Loan Amount |
|---|---|---|---|
| Previous Owner | Barlow Daniel A | $116,500 | |
| Previous Owner | Barlow Daniel A | $90,250 |
Source: Public Records
Tax History Compared to Growth
Tax History
| Year | Tax Paid | Tax Assessment Tax Assessment Total Assessment is a certain percentage of the fair market value that is determined by local assessors to be the total taxable value of land and additions on the property. | Land | Improvement |
|---|---|---|---|---|
| 2024 | $2,387 | $73,626 | $23,142 | $50,484 |
| 2023 | $2,387 | $65,507 | $23,146 | $42,361 |
| 2022 | $2,334 | $65,507 | $23,146 | $42,361 |
| 2021 | $2,330 | $65,510 | $23,150 | $42,360 |
| 2020 | $1,754 | $47,430 | $14,840 | $32,590 |
| 2019 | $1,736 | $47,430 | $14,840 | $32,590 |
| 2018 | $1,901 | $46,800 | $14,840 | $31,960 |
| 2017 | $1,830 | $44,210 | $14,840 | $29,370 |
| 2016 | $1,790 | $44,210 | $14,840 | $29,370 |
| 2015 | $1,801 | $44,210 | $14,840 | $29,370 |
| 2014 | $825 | $41,010 | $14,840 | $26,170 |
| 2013 | $1,654 | $41,010 | $14,840 | $26,170 |
Source: Public Records
Map
Nearby Homes
- 3638 E Rock Cliff Dr
- 3776 E Pine Dr
- 3500 Woodhill Dr
- 3571 E Eagle Beach Cir
- 146 N Harbors End Dr Unit 21A
- 1217 NE Catawba Rd
- 1217 NE Catawba Rd Unit 15
- 1217 NE Catawba Rd Unit 13
- 1217 NE Catawba Rd Unit 14
- 1217 NE Catawba Rd Unit 16
- 2817 E Harbor Rd
- 4075 E Christopher Dr
- 4881 E Wood Duck Ct
- 2656 E Harbor Rd Unit D-3
- 2656 E Harbor Rd Unit D-1
- 2656 E Harbor Rd Unit D-2
- 4690 E Johnson Ave
- 1876 N Lakewood Ave
- 584 NE Catawba Rd
- 478 NE Catawba Rd
- 588 NE Catawba Rd
- 600 N Hidden Harbor Dr
- 597 N Hidden Harbor Dr
- 597 N Hidden Harbor Dr Unit 1
- 3930 E Wine Cellar Rd
- 605 N Hidden Harbor Dr
- 610 N Hidden Harbor Dr
- 700 N Hidden Harbor Dr
- 730 NE Catawba Rd
- 630 N Hidden Harbor Dr
- 613 N Hidden Harbor Dr
- 700 NE Catawba Rd
- 708 N Hidden Harbor Dr
- 621 N Hidden Harbor Dr
- 3946 E Vineyard Village Dr
- 640 N Hidden Harbor Dr
- 726 N Hidden Harbor Dr
- 629 N Hidden Harbor Dr