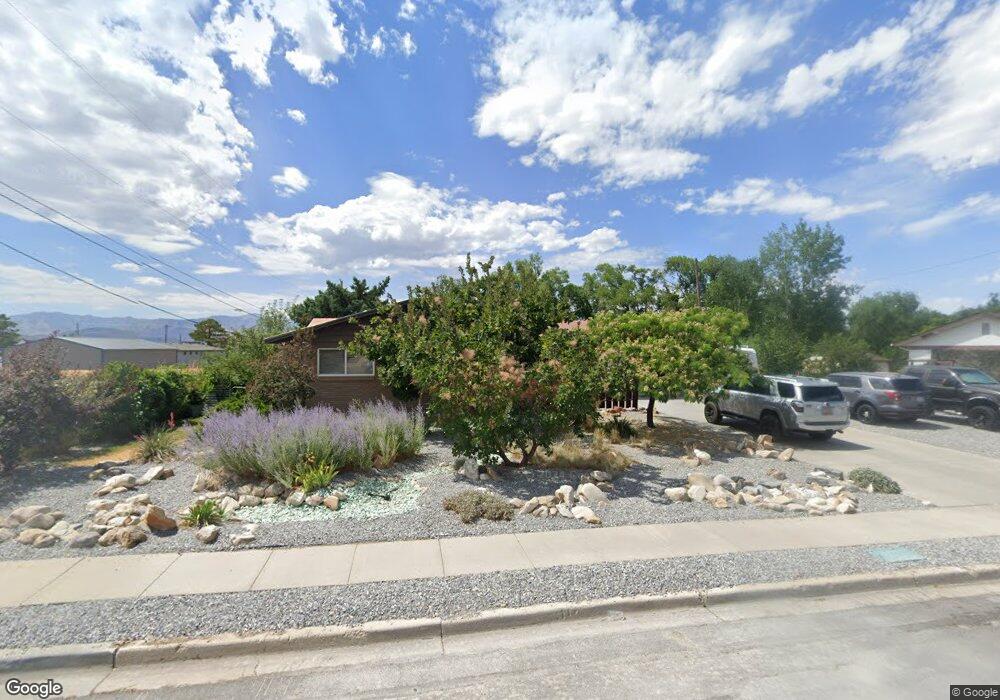
526 S 525 W Unit 13 Tooele, UT 84074
Estimated Value: $450,000 - $499,000
3
Beds
3
Baths
3,706
Sq Ft
$126/Sq Ft
Est. Value
About This Home
This home is located at 526 S 525 W Unit 13, Tooele, UT 84074 and is currently estimated at $466,348, approximately $125 per square foot. 526 S 525 W Unit 13 is a home located in Tooele County with nearby schools including West Elementary School, Northlake Elementary School, and Tooele Junior High School.
Ownership History
Date
Name
Owned For
Owner Type
Purchase Details
Closed on
Jul 21, 2023
Sold by
Fisher Tyson J
Bought by
Fisher Tyson J and Jensen Chelsea A
Current Estimated Value
Home Financials for this Owner
Home Financials are based on the most recent Mortgage that was taken out on this home.
Original Mortgage
$244,300
Outstanding Balance
$238,385
Interest Rate
6.71%
Mortgage Type
New Conventional
Estimated Equity
$227,963
Purchase Details
Closed on
Jul 20, 2023
Sold by
Anne B Smith Family Trust
Bought by
Fisher Tyson J
Home Financials for this Owner
Home Financials are based on the most recent Mortgage that was taken out on this home.
Original Mortgage
$244,300
Outstanding Balance
$238,385
Interest Rate
6.71%
Mortgage Type
New Conventional
Estimated Equity
$227,963
Purchase Details
Closed on
Jul 19, 2007
Sold by
Smith Anne B
Bought by
Smith Anne B and Anne B Smith Family Trust
Create a Home Valuation Report for This Property
The Home Valuation Report is an in-depth analysis detailing your home's value as well as a comparison with similar homes in the area
Home Values in the Area
Average Home Value in this Area
Purchase History
| Date | Buyer | Sale Price | Title Company |
|---|---|---|---|
| Fisher Tyson J | -- | Cottonwood Title | |
| Fisher Tyson J | -- | Tooele Title | |
| Smith Anne B | -- | None Available |
Source: Public Records
Mortgage History
| Date | Status | Borrower | Loan Amount |
|---|---|---|---|
| Open | Fisher Tyson J | $244,300 |
Source: Public Records
Tax History Compared to Growth
Tax History
| Year | Tax Paid | Tax Assessment Tax Assessment Total Assessment is a certain percentage of the fair market value that is determined by local assessors to be the total taxable value of land and additions on the property. | Land | Improvement |
|---|---|---|---|---|
| 2025 | $2,983 | $248,849 | $70,813 | $178,036 |
| 2024 | $3,300 | $251,920 | $70,813 | $181,107 |
| 2023 | $3,300 | $245,962 | $67,406 | $178,556 |
| 2022 | $3,087 | $265,569 | $78,128 | $187,441 |
| 2021 | $2,523 | $181,579 | $27,878 | $153,701 |
| 2020 | $2,387 | $297,995 | $50,688 | $247,307 |
| 2019 | $2,211 | $271,498 | $50,688 | $220,810 |
| 2018 | $1,988 | $231,508 | $47,500 | $184,008 |
| 2017 | $1,756 | $242,608 | $34,438 | $208,170 |
| 2016 | $1,435 | $118,500 | $18,941 | $99,559 |
| 2015 | $1,435 | $104,342 | $0 | $0 |
| 2014 | -- | $104,342 | $0 | $0 |
Source: Public Records
Map
Nearby Homes