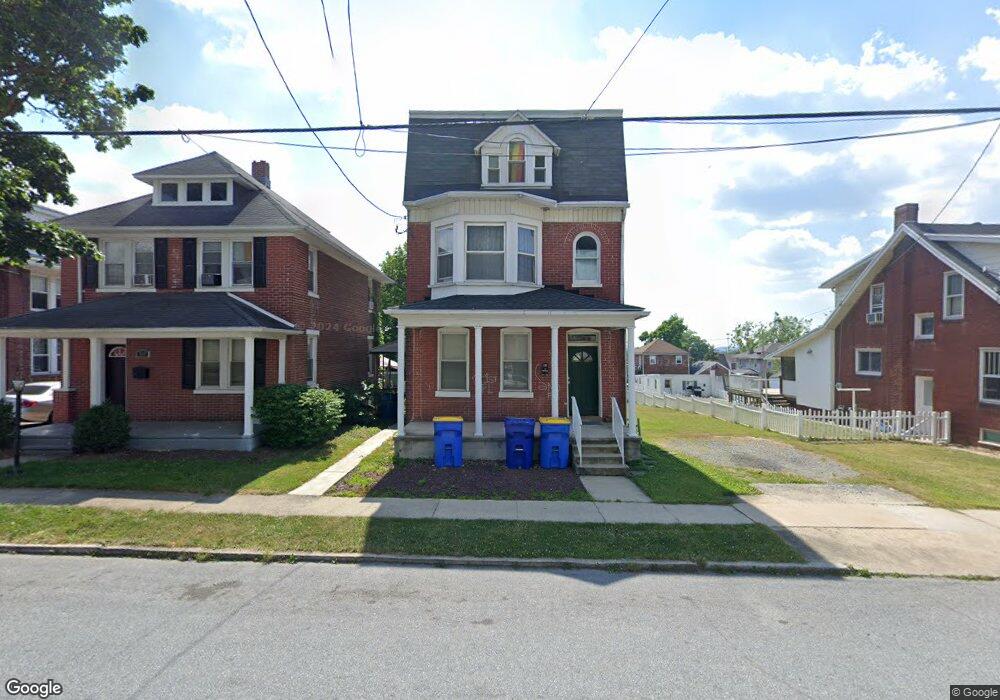
526 S Ogontz St York, PA 17403
Valley View NeighborhoodEstimated Value: $194,000 - $252,000
4
Beds
3
Baths
2,659
Sq Ft
$83/Sq Ft
Est. Value
About This Home
This home is located at 526 S Ogontz St, York, PA 17403 and is currently estimated at $221,667, approximately $83 per square foot. 526 S Ogontz St is a home located in York County with nearby schools including York Suburban Middle School, York Suburban Senior High School, and Tidings of Peace Christian School.
Ownership History
Date
Name
Owned For
Owner Type
Purchase Details
Closed on
Jul 15, 2021
Sold by
Surdich Darren A and Surdich Stella F
Bought by
Spagnola Nicholas V and Spagnola Lennie
Current Estimated Value
Purchase Details
Closed on
Feb 25, 2011
Sold by
J L M Properties Inc
Bought by
Surdich Darren A and Surdich Stella F
Home Financials for this Owner
Home Financials are based on the most recent Mortgage that was taken out on this home.
Original Mortgage
$245,000
Interest Rate
4.83%
Mortgage Type
Future Advance Clause Open End Mortgage
Purchase Details
Closed on
Dec 3, 2010
Sold by
Sylvester George M and Sylvester Tammy J
Bought by
J L M Properties Inc
Purchase Details
Closed on
Mar 31, 2000
Sold by
Smith Dennis R
Bought by
Sylvester George M and Sylvester Tammy J
Home Financials for this Owner
Home Financials are based on the most recent Mortgage that was taken out on this home.
Original Mortgage
$72,000
Interest Rate
8.3%
Create a Home Valuation Report for This Property
The Home Valuation Report is an in-depth analysis detailing your home's value as well as a comparison with similar homes in the area
Home Values in the Area
Average Home Value in this Area
Purchase History
| Date | Buyer | Sale Price | Title Company |
|---|---|---|---|
| Spagnola Nicholas V | $135,000 | None Available | |
| Surdich Darren A | $120,000 | None Available | |
| J L M Properties Inc | $108,000 | None Available | |
| Sylvester George M | $90,000 | -- |
Source: Public Records
Mortgage History
| Date | Status | Borrower | Loan Amount |
|---|---|---|---|
| Previous Owner | Surdich Darren A | $245,000 | |
| Previous Owner | Sylvester George M | $72,000 | |
| Closed | Sylvester George M | $13,500 |
Source: Public Records
Tax History Compared to Growth
Tax History
| Year | Tax Paid | Tax Assessment Tax Assessment Total Assessment is a certain percentage of the fair market value that is determined by local assessors to be the total taxable value of land and additions on the property. | Land | Improvement |
|---|---|---|---|---|
| 2025 | $5,917 | $156,290 | $25,870 | $130,420 |
| 2024 | $5,763 | $156,290 | $25,870 | $130,420 |
| 2023 | $5,587 | $156,290 | $25,870 | $130,420 |
| 2022 | $5,437 | $156,290 | $25,870 | $130,420 |
| 2021 | $5,224 | $156,290 | $25,870 | $130,420 |
| 2020 | $5,187 | $156,290 | $25,870 | $130,420 |
| 2019 | $5,057 | $156,290 | $25,870 | $130,420 |
| 2018 | $4,951 | $156,290 | $25,870 | $130,420 |
| 2017 | $4,885 | $156,290 | $25,870 | $130,420 |
| 2016 | $0 | $156,290 | $25,870 | $130,420 |
| 2015 | -- | $156,290 | $25,870 | $130,420 |
| 2014 | -- | $156,290 | $25,870 | $130,420 |
Source: Public Records
Map
Nearby Homes
- 1222 Elm St
- 609 S Albemarle St
- 808 Hill St
- 722 Lancaster Ave
- 1108 E Jackson St
- 1447 4th Ave
- 1626 Mount Rose Ave
- 1193 Irving Ave
- 958 E Princess St
- 639 Dallas St
- 368 Norway St
- 338 Norway St
- 929 Wellington St
- 1327 Hill St
- 68 S Albemarle St
- 715 E Maple St
- 1230 S Albemarle St
- 959 E King St
- 527 Girard Ave
- 1262 S Albemarle St
- 520 S Ogontz St
- 532 S Ogontz St
- 536 S Ogontz St
- 516 S Ogontz St
- 538 S Ogontz St
- 1342 E Prospect St
- 1346 E Prospect St
- 523 S Ogontz St
- 1338 E Prospect St
- 1338 E Prospect St Unit 101
- 1340 E Prospect St
- 1336 E Prospect St
- 515 S Ogontz St
- 535 S Ogontz St
- 513 S Ogontz St
- 1320 E Prospect St
- 545 S Ogontz St
- 1312 E Prospect St
- 547 S Ogontz St
- 505 S Ogontz St