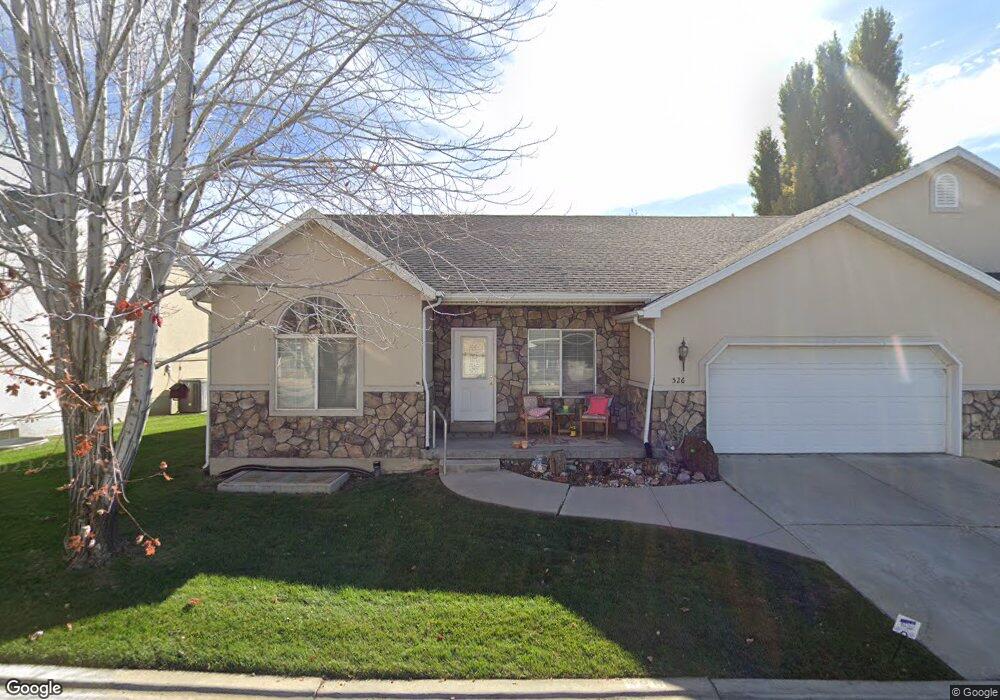
526 Sierra Ln Pleasant Grove, UT 84062
Estimated Value: $456,000 - $501,020
4
Beds
3
Baths
3,062
Sq Ft
$158/Sq Ft
Est. Value
About This Home
This home is located at 526 Sierra Ln, Pleasant Grove, UT 84062 and is currently estimated at $484,505, approximately $158 per square foot. 526 Sierra Ln is a home located in Utah County with nearby schools including Lindon Elementary School, Oak Canyon Junior High School, and Pleasant Grove High School.
Ownership History
Date
Name
Owned For
Owner Type
Purchase Details
Closed on
Sep 23, 2024
Sold by
Mack And Ronilla Cook Irrevocable Trust and Embry Maxine Cook
Bought by
Learn Amy Cathryn and Learn Brenda June
Current Estimated Value
Home Financials for this Owner
Home Financials are based on the most recent Mortgage that was taken out on this home.
Original Mortgage
$325,000
Outstanding Balance
$321,347
Interest Rate
6.47%
Mortgage Type
New Conventional
Estimated Equity
$163,158
Purchase Details
Closed on
Jul 7, 2021
Sold by
Cook Mack R and Cook Ronilla H
Bought by
Embry Maxine Cook and Embry Mack
Purchase Details
Closed on
Mar 2, 2001
Sold by
Cook Mack R and Cook Ronilla H
Bought by
Cook Mack R and Cook Ronilla H
Home Financials for this Owner
Home Financials are based on the most recent Mortgage that was taken out on this home.
Original Mortgage
$50,000
Interest Rate
6.98%
Mortgage Type
Credit Line Revolving
Create a Home Valuation Report for This Property
The Home Valuation Report is an in-depth analysis detailing your home's value as well as a comparison with similar homes in the area
Home Values in the Area
Average Home Value in this Area
Purchase History
| Date | Buyer | Sale Price | Title Company |
|---|---|---|---|
| Learn Amy Cathryn | -- | Real Advantage Title | |
| Embry Maxine Cook | -- | None Available | |
| Cook Mack R | -- | First American Title Co |
Source: Public Records
Mortgage History
| Date | Status | Borrower | Loan Amount |
|---|---|---|---|
| Open | Learn Amy Cathryn | $325,000 | |
| Previous Owner | Cook Mack R | $50,000 |
Source: Public Records
Tax History Compared to Growth
Tax History
| Year | Tax Paid | Tax Assessment Tax Assessment Total Assessment is a certain percentage of the fair market value that is determined by local assessors to be the total taxable value of land and additions on the property. | Land | Improvement |
|---|---|---|---|---|
| 2025 | $2,150 | $468,100 | $68,800 | $399,300 |
| 2024 | $2,150 | $256,575 | $0 | $0 |
| 2023 | $2,101 | $256,740 | $0 | $0 |
| 2022 | $2,170 | $263,835 | $0 | $0 |
| 2021 | $1,869 | $346,000 | $51,900 | $294,100 |
| 2020 | $1,759 | $319,100 | $47,900 | $271,200 |
| 2019 | $1,700 | $319,100 | $47,900 | $271,200 |
| 2018 | $1,607 | $285,100 | $42,800 | $242,300 |
| 2017 | $1,392 | $131,505 | $0 | $0 |
| 2016 | $1,315 | $119,900 | $0 | $0 |
| 2015 | $1,388 | $119,900 | $0 | $0 |
| 2014 | $1,305 | $111,650 | $0 | $0 |
Source: Public Records
Map
Nearby Homes