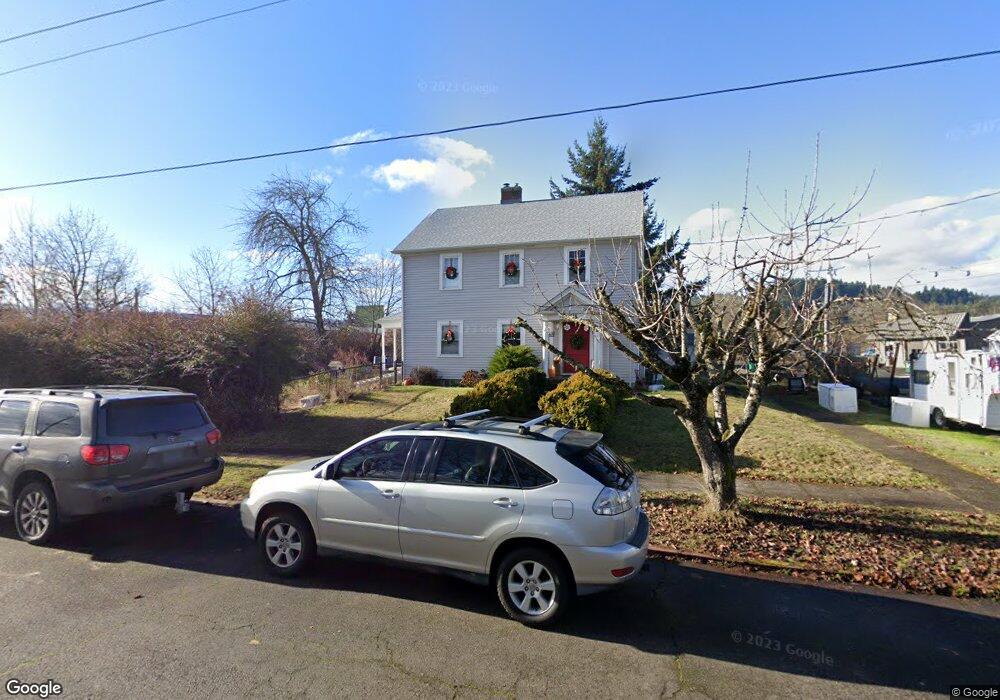
52613 NE 2nd St Scappoose, OR 97056
Estimated Value: $485,000 - $573,000
4
Beds
3
Baths
2,785
Sq Ft
$190/Sq Ft
Est. Value
About This Home
This home is located at 52613 NE 2nd St, Scappoose, OR 97056 and is currently estimated at $529,426, approximately $190 per square foot. 52613 NE 2nd St is a home located in Columbia County with nearby schools including Scappoose High School, South Columbia Family School, and Scappoose Adventist School.
Ownership History
Date
Name
Owned For
Owner Type
Purchase Details
Closed on
Sep 30, 2005
Sold by
Grogg Brandon and Grogg Jacqualynn
Bought by
Hurliman Nicholas A and Hurliman Khair Un Nisa D
Current Estimated Value
Home Financials for this Owner
Home Financials are based on the most recent Mortgage that was taken out on this home.
Original Mortgage
$53,000
Interest Rate
5.63%
Mortgage Type
Unknown
Purchase Details
Closed on
Sep 15, 2004
Sold by
Soderholm Diane S
Bought by
Grogg Brandon and Grogg Jacqualynn
Home Financials for this Owner
Home Financials are based on the most recent Mortgage that was taken out on this home.
Original Mortgage
$44,400
Interest Rate
5.8%
Mortgage Type
Stand Alone Second
Create a Home Valuation Report for This Property
The Home Valuation Report is an in-depth analysis detailing your home's value as well as a comparison with similar homes in the area
Home Values in the Area
Average Home Value in this Area
Purchase History
| Date | Buyer | Sale Price | Title Company |
|---|---|---|---|
| Hurliman Nicholas A | $265,000 | Ticor Title | |
| Grogg Brandon | $222,000 | First American Title Company |
Source: Public Records
Mortgage History
| Date | Status | Borrower | Loan Amount |
|---|---|---|---|
| Closed | Hurliman Nicholas A | $53,000 | |
| Previous Owner | Grogg Brandon | $44,400 | |
| Previous Owner | Grogg Brandon | $177,600 |
Source: Public Records
Tax History Compared to Growth
Tax History
| Year | Tax Paid | Tax Assessment Tax Assessment Total Assessment is a certain percentage of the fair market value that is determined by local assessors to be the total taxable value of land and additions on the property. | Land | Improvement |
|---|---|---|---|---|
| 2025 | $4,123 | $250,390 | $120,320 | $130,070 |
| 2024 | $4,008 | $243,100 | $116,820 | $126,280 |
| 2023 | $3,971 | $236,020 | $104,830 | $131,190 |
| 2022 | $3,804 | $229,150 | $101,780 | $127,370 |
| 2021 | $3,695 | $222,480 | $108,580 | $113,900 |
| 2020 | $3,427 | $216,000 | $100,930 | $115,070 |
| 2019 | $3,337 | $209,710 | $97,190 | $112,520 |
| 2018 | $3,261 | $203,610 | $113,900 | $89,710 |
| 2017 | $3,202 | $197,680 | $110,580 | $87,100 |
| 2016 | $3,162 | $191,930 | $107,370 | $84,560 |
| 2015 | $3,002 | $186,340 | $100,220 | $86,120 |
| 2014 | $2,926 | $180,920 | $112,820 | $68,100 |
Source: Public Records
Map
Nearby Homes
- 33399 NW Ej Smith Rd
- 33374 Wickstrom Dr
- 52866 NE 2nd St
- 51587 SE Oak St
- 51425 SE Oak St Unit 65
- 52256 SE 6th Ct
- 52171 Casswell Dr
- 53194 Columbia River Hwy
- 32904 NW View Terrace Place
- 33375 SW Rokin Way
- 33363 SW Rokin Way
- 32952 NW Ridge Dr
- 33358 SW Rokin Way
- 52144 SE 8th St
- 33344 SW Rokin Way
- 33370 SW Rokin Way
- 52269 SE Tyler St
- 51925 Columbia River Hwy
- 32898 SW Keys Landing Way
- 52238 Teakwood Dr
- 52639 NE 2nd St
- 33381 NW Wickstrom Dr
- 52589 NE 2nd St
- 52616 NE 2nd St
- 52608 NE 2nd St
- 52644 NE 1st St Unit 1
- 52648 NE 1st St
- 52657 NE 2nd St
- 52588 NE 2nd St
- 52638 NE 2nd St
- 52615 NE 3rd St
- 52667 NE 2nd St
- 52597 NE 3rd St
- 52666 NE 2nd St
- 33615 NE Prairie St
- 52643 NE 3rd St
- 52657 NE 3rd St
- 52687 NE 2nd St
- 33620 NE Laurel St
- 52539 NE 3rd St