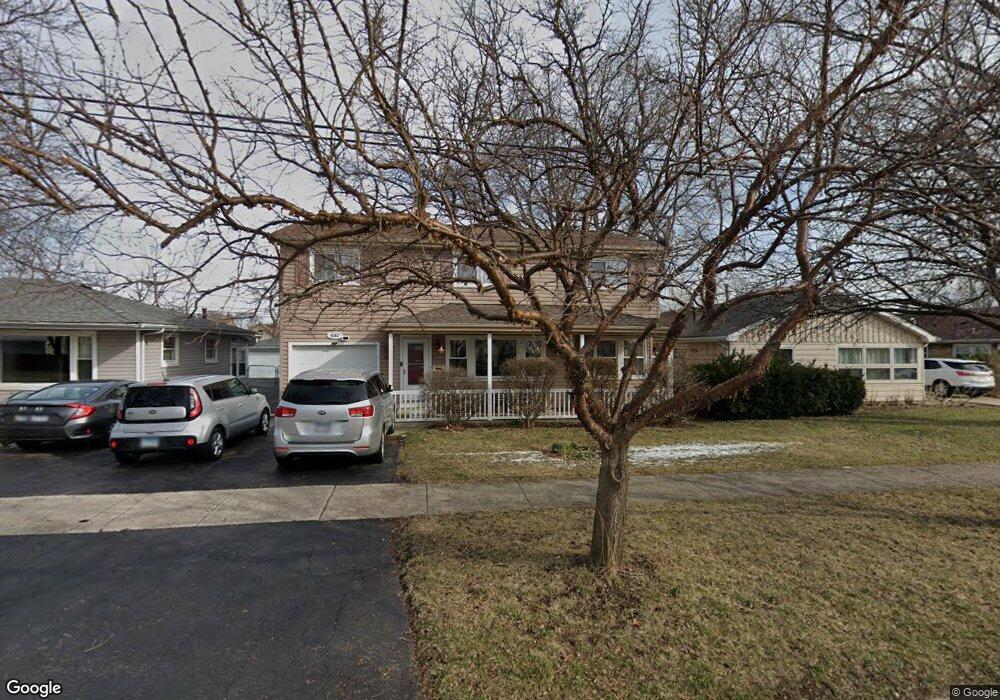
5262 W 91st St Oak Lawn, IL 60453
Estimated Value: $300,000 - $394,000
4
Beds
2
Baths
1,882
Sq Ft
$184/Sq Ft
Est. Value
About This Home
This home is located at 5262 W 91st St, Oak Lawn, IL 60453 and is currently estimated at $346,164, approximately $183 per square foot. 5262 W 91st St is a home located in Cook County with nearby schools including J Covington Elementary School, Hometown Elementary School, and Sward Elementary School.
Ownership History
Date
Name
Owned For
Owner Type
Purchase Details
Closed on
Aug 19, 2020
Sold by
Chicago Title Land Trust Company
Bought by
Ruhl Connie and Ruhl Robert
Current Estimated Value
Purchase Details
Closed on
May 26, 1999
Sold by
Mccollom Patricia M
Bought by
Creevy Joseph G and Creevy Ava M
Home Financials for this Owner
Home Financials are based on the most recent Mortgage that was taken out on this home.
Original Mortgage
$115,000
Interest Rate
6.99%
Purchase Details
Closed on
Jul 3, 1996
Sold by
Jonker Patricia M and Mccollom Patricia
Bought by
Mccollom Patricia M
Home Financials for this Owner
Home Financials are based on the most recent Mortgage that was taken out on this home.
Original Mortgage
$77,000
Interest Rate
8.95%
Purchase Details
Closed on
Mar 12, 1996
Sold by
Jonker Raymond P
Bought by
Jonker Patricia M and Mccollom Patricia
Create a Home Valuation Report for This Property
The Home Valuation Report is an in-depth analysis detailing your home's value as well as a comparison with similar homes in the area
Home Values in the Area
Average Home Value in this Area
Purchase History
| Date | Buyer | Sale Price | Title Company |
|---|---|---|---|
| Ruhl Connie | -- | None Available | |
| Creevy Joseph G | $130,000 | Prairie Title | |
| Mccollom Patricia M | -- | Lawyers Title Insurance Corp | |
| Jonker Patricia M | -- | -- |
Source: Public Records
Mortgage History
| Date | Status | Borrower | Loan Amount |
|---|---|---|---|
| Previous Owner | Creevy Joseph G | $115,000 | |
| Previous Owner | Mccollom Patricia M | $77,000 |
Source: Public Records
Tax History Compared to Growth
Tax History
| Year | Tax Paid | Tax Assessment Tax Assessment Total Assessment is a certain percentage of the fair market value that is determined by local assessors to be the total taxable value of land and additions on the property. | Land | Improvement |
|---|---|---|---|---|
| 2024 | $6,363 | $26,771 | $4,375 | $22,396 |
| 2023 | $4,828 | $26,771 | $4,375 | $22,396 |
| 2022 | $4,828 | $18,904 | $3,750 | $15,154 |
| 2021 | $4,782 | $18,903 | $3,750 | $15,153 |
| 2020 | $6,545 | $21,133 | $3,750 | $17,383 |
| 2019 | $5,314 | $18,082 | $3,437 | $14,645 |
| 2018 | $5,110 | $18,082 | $3,437 | $14,645 |
| 2017 | $5,140 | $18,082 | $3,437 | $14,645 |
| 2016 | $5,679 | $18,000 | $2,812 | $15,188 |
| 2015 | $5,571 | $18,000 | $2,812 | $15,188 |
| 2014 | $5,664 | $18,380 | $2,812 | $15,568 |
| 2013 | $4,752 | $17,399 | $2,812 | $14,587 |
Source: Public Records
Map
Nearby Homes
- 5316 Otto Place
- 9135 S 53rd Ave
- 5113 W 90th St
- 5306 Kimball Place
- 9209 S 53rd Ct
- 5232 Cass St
- 5175 W 88th Place
- 5500 W 90th St
- 8845 S 51st Ave
- 9336 Tulley Ave
- 5555 W 90th St
- 4930 W 92nd St
- 9212 S 49th Ct
- 9005 S 49th Ct
- 9239 S 55th Ct
- 9020 S 49th Ave
- 9228 S 55th Ct
- 9330 S 50th Ave
- 8737 Sproat Ave Unit 2
- 9439 S 52nd Ave
- 5266 W 91st St
- 5258 W 91st St
- 5270 W 91st St
- 5254 W 91st St
- 5265 Otto Place
- 5257 Otto Place
- 5261 Otto Place
- 5274 W 91st St
- 9102 S 51st Ave
- 9102 S 52nd Ct
- 5269 Otto Place
- 5253 Otto Place
- 5273 Otto Place
- 5278 W 91st St
- 9101 S 53rd Ave
- 9106 S 52nd Ct
- 5277 Otto Place
- 5190 W 91st St
- 5302 W 91st St
- 9103 S 53rd Ave