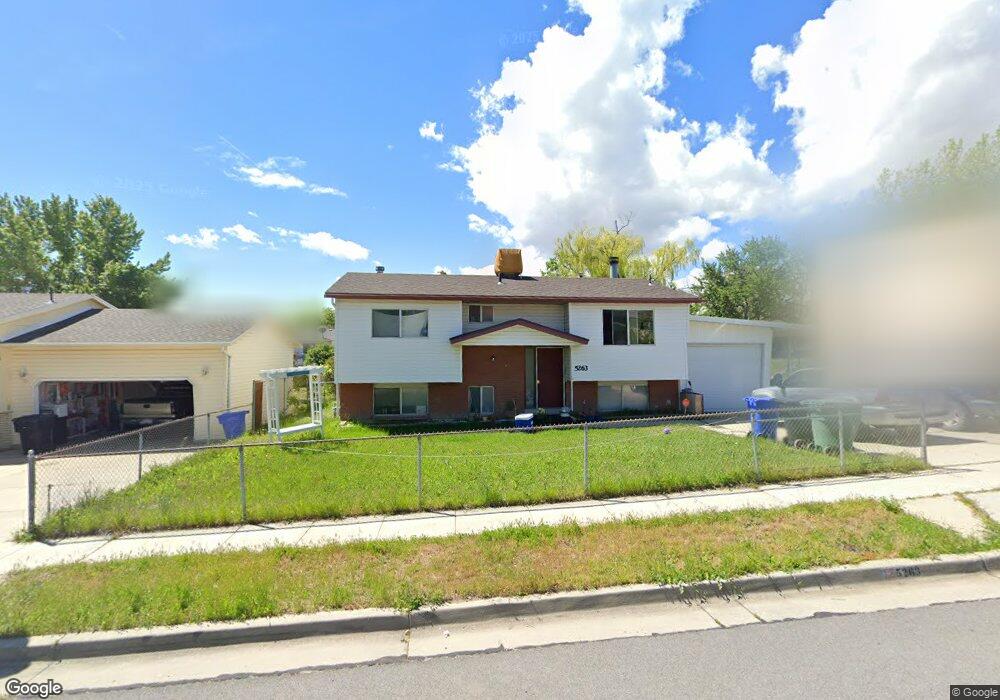
5263 Cyclamen Way West Jordan, UT 84081
Oquirrh NeighborhoodEstimated Value: $453,000 - $476,000
3
Beds
2
Baths
938
Sq Ft
$492/Sq Ft
Est. Value
About This Home
This home is located at 5263 Cyclamen Way, West Jordan, UT 84081 and is currently estimated at $461,585, approximately $492 per square foot. 5263 Cyclamen Way is a home located in Salt Lake County with nearby schools including Jim Bridger Elementary School, Thomas Jefferson Jr High School, and Kearns High School.
Ownership History
Date
Name
Owned For
Owner Type
Purchase Details
Closed on
May 11, 2017
Sold by
Shreeve Ashley Ruth and Estate Of Mark Dean Jeffries
Bought by
Dixon Timothy
Current Estimated Value
Home Financials for this Owner
Home Financials are based on the most recent Mortgage that was taken out on this home.
Original Mortgage
$230,743
Outstanding Balance
$192,675
Interest Rate
4.25%
Mortgage Type
FHA
Estimated Equity
$268,910
Purchase Details
Closed on
May 10, 2017
Sold by
Dixon Timothy
Bought by
Dixon Timothy and Jolley Randi
Home Financials for this Owner
Home Financials are based on the most recent Mortgage that was taken out on this home.
Original Mortgage
$230,743
Outstanding Balance
$192,675
Interest Rate
4.25%
Mortgage Type
FHA
Estimated Equity
$268,910
Purchase Details
Closed on
Jun 6, 2002
Sold by
Jeffries Mark Dean and Jeffries Sandra
Bought by
Jeffries Mark D
Home Financials for this Owner
Home Financials are based on the most recent Mortgage that was taken out on this home.
Original Mortgage
$77,600
Interest Rate
6.83%
Create a Home Valuation Report for This Property
The Home Valuation Report is an in-depth analysis detailing your home's value as well as a comparison with similar homes in the area
Home Values in the Area
Average Home Value in this Area
Purchase History
| Date | Buyer | Sale Price | Title Company |
|---|---|---|---|
| Dixon Timothy | -- | American Title | |
| Dixon Timothy | -- | Monument Title Ins Co | |
| Jeffries Mark D | -- | First American Title |
Source: Public Records
Mortgage History
| Date | Status | Borrower | Loan Amount |
|---|---|---|---|
| Open | Dixon Timothy | $230,743 | |
| Closed | Dixon Timothy | $12,500 | |
| Previous Owner | Jeffries Mark D | $77,600 |
Source: Public Records
Tax History Compared to Growth
Tax History
| Year | Tax Paid | Tax Assessment Tax Assessment Total Assessment is a certain percentage of the fair market value that is determined by local assessors to be the total taxable value of land and additions on the property. | Land | Improvement |
|---|---|---|---|---|
| 2025 | $2,662 | $445,000 | $131,300 | $313,700 |
| 2024 | $2,662 | $419,700 | $123,800 | $295,900 |
| 2023 | $2,626 | $394,300 | $119,100 | $275,200 |
| 2022 | $2,565 | $391,800 | $116,700 | $275,100 |
| 2021 | $2,349 | $318,800 | $89,800 | $229,000 |
| 2020 | $2,154 | $276,400 | $89,800 | $186,600 |
| 2019 | $2,118 | $264,000 | $84,700 | $179,300 |
| 2018 | $2,018 | $242,900 | $84,700 | $158,200 |
| 2017 | $1,652 | $209,300 | $84,700 | $124,600 |
| 2016 | $1,532 | $192,800 | $84,700 | $108,100 |
| 2015 | $1,500 | $175,600 | $81,100 | $94,500 |
| 2014 | $1,470 | $168,800 | $78,600 | $90,200 |
Source: Public Records
Map
Nearby Homes
- 6489 S Daffodil Way
- 6398 S Lobelia Dr
- 6568 S 5180 W
- 6157 S Impressions Dr
- 6437 S Lobelia Dr
- 5382 W Northlilac Ave
- 5352 Cassatt Cir
- 5183 W Cadenza Dr
- 5071 W Jarrad Rd
- 5275 Ridge Flower Way
- 5285 Ridge Flower Way
- 6635 S Milfoil Cir
- 4909 Sakura Ct
- 5281 Saguaro Dr
- 6706 Marshrock Rd
- 6022 S Park Wood Dr W
- 5924 S Cami Dawn Ct
- 5365 W Alpine Flower Cir
- 5627 Walnut Ridge Cir
- 5343 W Ridge Brook Way
- 5263 W Cyclamen Way
- 5251 W Cyclamen Way
- 5251 Cyclamen Way
- 5273 W Cyclamen Way
- 5273 Cyclamen Way
- 5262 W Clematis Way
- 5262 Clematis Way
- 5252 W Clematis Way
- 5272 W Clematis Way
- 5252 Clematis Way
- 5272 Clematis Way
- 5241 W Cyclamen Way
- 5241 Cyclamen Way
- 5285 Cyclamen Way
- 5268 Cyclamen Way
- 5268 W Cyclamen Way
- 5240 W Clematis Way
- 5240 Clematis Way
- 5282 Clematis Way
- 5244 W Cyclamen Place