Estimated Value: $477,000 - $537,000
4
Beds
3
Baths
1,753
Sq Ft
$292/Sq Ft
Est. Value
About This Home
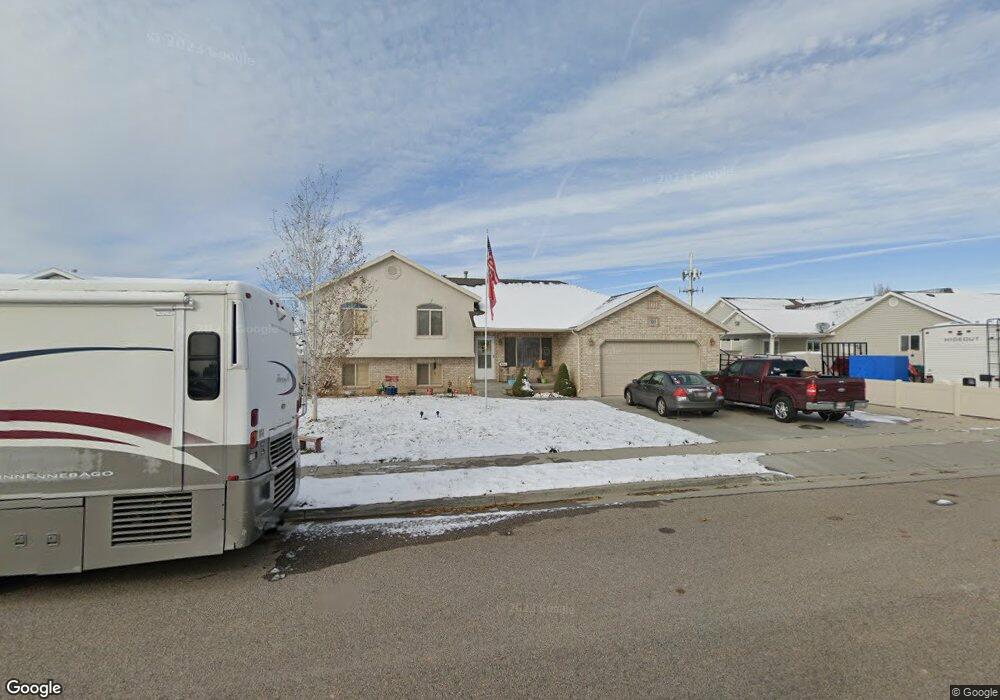
This home is located at 5263 S 3750 W, Roy, UT 84067 and is currently estimated at $511,887, approximately $292 per square foot. 5263 S 3750 W is a home located in Weber County with nearby schools including Freedom School, Roy Junior High School, and Roy High School.
Ownership History
Date
Name
Owned For
Owner Type
Purchase Details
Closed on
Sep 27, 2016
Sold by
Scadden Robert and Scadden Tracey
Bought by
The Robert L And Tracy A Scadden Trust
Current Estimated Value
Purchase Details
Closed on
Oct 20, 2004
Sold by
Micott Homes Inc
Bought by
Scadden Robert and Scadden Tracey
Purchase Details
Closed on
Dec 18, 2003
Sold by
R & K Development Llc
Bought by
R & K Development Llc
Home Financials for this Owner
Home Financials are based on the most recent Mortgage that was taken out on this home.
Original Mortgage
$253,875
Interest Rate
5.97%
Mortgage Type
Purchase Money Mortgage
Purchase Details
Closed on
Dec 10, 2003
Sold by
R & K Development Llc
Bought by
Micott Homes Inc
Home Financials for this Owner
Home Financials are based on the most recent Mortgage that was taken out on this home.
Original Mortgage
$253,875
Interest Rate
5.97%
Mortgage Type
Purchase Money Mortgage
Create a Home Valuation Report for This Property
The Home Valuation Report is an in-depth analysis detailing your home's value as well as a comparison with similar homes in the area
Home Values in the Area
Average Home Value in this Area
Purchase History
| Date | Buyer | Sale Price | Title Company |
|---|---|---|---|
| The Robert L And Tracy A Scadden Trust | -- | Intermountain Title Ins | |
| Scadden Robert | -- | First American Title | |
| R & K Development Llc | -- | -- | |
| Micott Homes Inc | -- | -- | |
| R & K Development Llc | -- | -- |
Source: Public Records
Mortgage History
| Date | Status | Borrower | Loan Amount |
|---|---|---|---|
| Previous Owner | Micott Homes Inc | $253,875 |
Source: Public Records
Tax History
| Year | Tax Paid | Tax Assessment Tax Assessment Total Assessment is a certain percentage of the fair market value that is determined by local assessors to be the total taxable value of land and additions on the property. | Land | Improvement |
|---|---|---|---|---|
| 2025 | $3,181 | $513,186 | $177,555 | $335,631 |
| 2024 | $3,108 | $277,749 | $97,655 | $180,094 |
| 2023 | $3,246 | $292,600 | $94,449 | $198,151 |
| 2022 | $3,131 | $288,750 | $72,332 | $216,418 |
| 2021 | $2,827 | $432,000 | $86,105 | $345,895 |
| 2020 | $2,634 | $369,000 | $86,105 | $282,895 |
| 2019 | $2,518 | $332,000 | $69,948 | $262,052 |
| 2018 | $2,392 | $297,000 | $59,958 | $237,042 |
| 2017 | $2,283 | $266,000 | $57,005 | $208,995 |
| 2016 | $2,047 | $127,437 | $30,259 | $97,178 |
| 2015 | $1,899 | $121,095 | $24,304 | $96,791 |
| 2014 | $1,917 | $121,095 | $24,304 | $96,791 |
Source: Public Records
Map
Nearby Homes
- 5412 S 3925 W
- 3443 W 5200 S Unit 2&3
- 5444 S 4050 W
- 4096 W 5075 S
- 3832 W 5625 S
- 3509 W 4835 S Unit 26
- 3517 W 4835 S Unit 27
- 4088 W 5050 S
- 4950 3900 West St
- 4813 S 3850 W
- 4216 W 5250 S
- 3826 W 5750 S
- 4239 W 5325 S
- 4218 W 5050 S
- 4277 W 5250 S
- 5773 S 3850 W
- 5155 S 3200 W
- 5035 S 4275 W
- 5529 S 3200 W
- 5321 S 3100 W
- 5263 S 3750 W Unit 44
- 5277 S 3750 W
- 5277 S 3750 W Unit 43
- 3759 W 5250 S Unit 45
- 3777 W 5250 S
- 5289 S 3750 W
- 5289 S 3750 W Unit 42
- 5272 S 3750 W
- 5272 S 3750 W Unit 32
- 3789 W 5250 S
- 3789 W 5250 S Unit 47
- 3766 W 5300 S
- 3766 W 5300 S Unit 41
- 3766 W 5300 S Unit 41
- 5260 S 3750 W
- 5260 S 3750 W Unit 31
- 5248 S 3750 W
- 5248 S 3750 W Unit 30
- 5235 S 3750 W
- 3764 W 5250 S
Your Personal Tour Guide
Ask me questions while you tour the home.