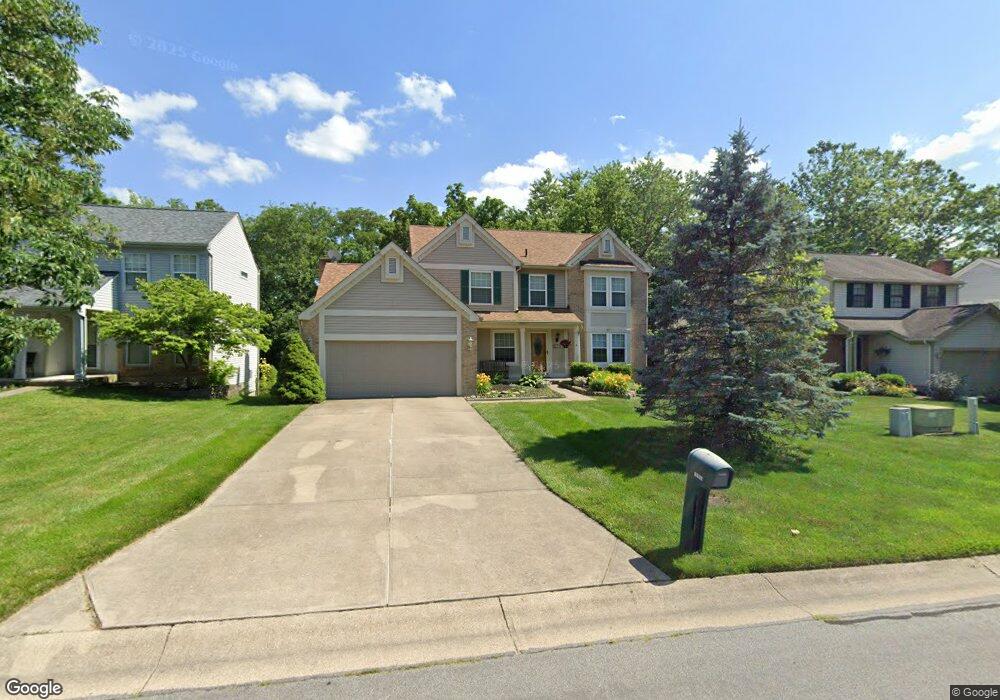
5265 Ashtree Dr West Chester, OH 45069
West Chester Township NeighborhoodEstimated Value: $417,000 - $458,000
4
Beds
3
Baths
2,267
Sq Ft
$193/Sq Ft
Est. Value
About This Home
This home is located at 5265 Ashtree Dr, West Chester, OH 45069 and is currently estimated at $437,502, approximately $192 per square foot. 5265 Ashtree Dr is a home located in Butler County with nearby schools including Freedom Elementary School, Lakota Ridge Junior School, and Lakota West High School.
Ownership History
Date
Name
Owned For
Owner Type
Purchase Details
Closed on
May 22, 2013
Sold by
Shearer Kathleen M
Bought by
Shearer Kathleen M and The James & Kathleen Sherar Trust
Current Estimated Value
Purchase Details
Closed on
Aug 13, 1997
Sold by
Suits Chris K
Bought by
Shearer James D and Shearer Kathleen M
Home Financials for this Owner
Home Financials are based on the most recent Mortgage that was taken out on this home.
Original Mortgage
$253,000
Interest Rate
7.71%
Mortgage Type
Balloon
Purchase Details
Closed on
Jul 22, 1994
Sold by
Walters Harold E
Bought by
Suits Chris K and Suits Moniqua
Home Financials for this Owner
Home Financials are based on the most recent Mortgage that was taken out on this home.
Original Mortgage
$142,000
Interest Rate
8.38%
Mortgage Type
New Conventional
Purchase Details
Closed on
Jan 1, 1990
Create a Home Valuation Report for This Property
The Home Valuation Report is an in-depth analysis detailing your home's value as well as a comparison with similar homes in the area
Home Values in the Area
Average Home Value in this Area
Purchase History
| Date | Buyer | Sale Price | Title Company |
|---|---|---|---|
| Shearer Kathleen M | -- | None Available | |
| Shearer James D | $171,000 | -- | |
| Suits Chris K | $158,000 | -- | |
| -- | $148,200 | -- |
Source: Public Records
Mortgage History
| Date | Status | Borrower | Loan Amount |
|---|---|---|---|
| Previous Owner | Shearer James D | $253,000 | |
| Previous Owner | Suits Chris K | $142,000 |
Source: Public Records
Tax History Compared to Growth
Tax History
| Year | Tax Paid | Tax Assessment Tax Assessment Total Assessment is a certain percentage of the fair market value that is determined by local assessors to be the total taxable value of land and additions on the property. | Land | Improvement |
|---|---|---|---|---|
| 2024 | $4,677 | $122,770 | $14,310 | $108,460 |
| 2023 | $4,657 | $128,890 | $14,310 | $114,580 |
| 2022 | $4,849 | $86,810 | $14,310 | $72,500 |
| 2021 | $4,398 | $83,360 | $14,310 | $69,050 |
| 2020 | $4,502 | $83,360 | $14,310 | $69,050 |
| 2019 | $7,095 | $74,040 | $14,320 | $59,720 |
| 2018 | $4,194 | $74,040 | $14,320 | $59,720 |
| 2017 | $4,269 | $74,040 | $14,320 | $59,720 |
| 2016 | $4,077 | $66,590 | $14,320 | $52,270 |
| 2015 | $4,071 | $66,590 | $14,320 | $52,270 |
| 2014 | $3,659 | $66,590 | $14,320 | $52,270 |
| 2013 | $3,659 | $58,140 | $12,940 | $45,200 |
Source: Public Records
Map
Nearby Homes
- 8135 Timbertree Way Unit 3
- Promenade Plus Plan at Bel Haven
- Provenance Plan at Bel Haven
- Portico Plus Plan at Bel Haven
- Promenade Plan at Bel Haven
- Palazzo Plan at Bel Haven
- 7717 Whitehall Cir W
- 8354 Park Place
- 8330 Park Place
- 5365 Leaf Back Dr
- 5396 Leatherwood Dr
- 5397 Leatherwood Dr
- 7956 Bobtail Ct
- 7712 Whitehall Cir E
- 5671 Tylersville Rd
- 5271 Pros Dr
- 7392 Wheatland Meadow Ct
- 5356 Pros Dr
- 8397 Spring Valley Ct
- 7690 Wharton Ct
- 5271 Ashtree Dr
- 5255 Ashtree Dr
- 5277 Ashtree Dr
- 5249 Ashtree Dr
- 5287 Ashtree Dr
- 5243 Ashtree Dr
- 7857 Glen Oaks Ct
- 5332 Crossbridge Dr
- 7852 Glen Oaks Ct
- 7897 Ashford Glen Ct
- 5299 Ashtree Dr
- 7847 Glen Oaks Ct
- 7844 Glen Oaks Ct
- 7876 Willow Run Ct
- 7845 Glen Oaks Ct
- 7868 Willow Run Ct
- 7853 Ashford Glen Ct
- 7836 Glen Oaks Ct
- 5223 Ashtree Dr
- 7862 Willow Run Ct