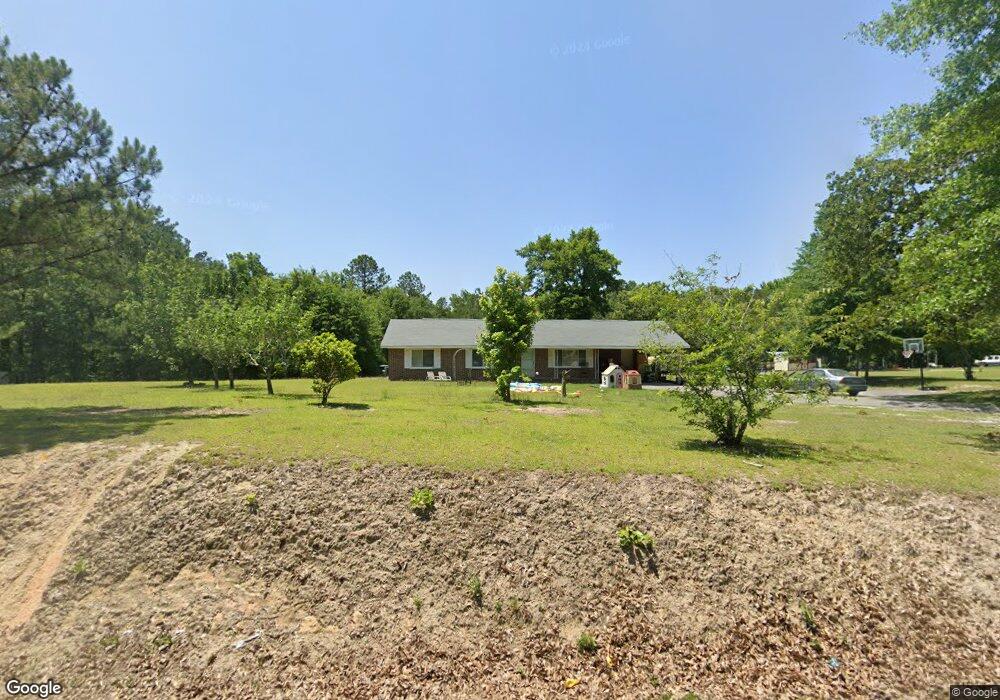
5265 Dixon Rd Lizella, GA 31052
Estimated Value: $174,000 - $209,000
3
Beds
2
Baths
1,440
Sq Ft
$130/Sq Ft
Est. Value
About This Home
This home is located at 5265 Dixon Rd, Lizella, GA 31052 and is currently estimated at $187,905, approximately $130 per square foot. 5265 Dixon Rd is a home located in Bibb County with nearby schools including Skyview Elementary School, Rutland Middle School, and Rutland High School.
Ownership History
Date
Name
Owned For
Owner Type
Purchase Details
Closed on
Jul 23, 2020
Sold by
Ray Vincent J
Bought by
Mitchell Kaylee K
Current Estimated Value
Home Financials for this Owner
Home Financials are based on the most recent Mortgage that was taken out on this home.
Original Mortgage
$107,651
Outstanding Balance
$95,635
Interest Rate
3.2%
Mortgage Type
FHA
Estimated Equity
$92,270
Purchase Details
Closed on
Jun 10, 2016
Sold by
Cavender John M
Bought by
Ray Vincent J
Home Financials for this Owner
Home Financials are based on the most recent Mortgage that was taken out on this home.
Original Mortgage
$106,900
Interest Rate
3.57%
Mortgage Type
VA
Purchase Details
Closed on
Aug 25, 2010
Sold by
Cavender John M
Bought by
Cavender John M and Yarborough Ginny Michelle
Create a Home Valuation Report for This Property
The Home Valuation Report is an in-depth analysis detailing your home's value as well as a comparison with similar homes in the area
Home Values in the Area
Average Home Value in this Area
Purchase History
| Date | Buyer | Sale Price | Title Company |
|---|---|---|---|
| Mitchell Kaylee K | $120,000 | None Available | |
| Ray Vincent J | $106,900 | -- | |
| Cavender John M | -- | None Available |
Source: Public Records
Mortgage History
| Date | Status | Borrower | Loan Amount |
|---|---|---|---|
| Open | Mitchell Kaylee K | $107,651 | |
| Previous Owner | Ray Vincent J | $106,900 |
Source: Public Records
Tax History Compared to Growth
Tax History
| Year | Tax Paid | Tax Assessment Tax Assessment Total Assessment is a certain percentage of the fair market value that is determined by local assessors to be the total taxable value of land and additions on the property. | Land | Improvement |
|---|---|---|---|---|
| 2024 | $1,200 | $47,250 | $6,827 | $40,423 |
| 2023 | $1,200 | $47,250 | $6,827 | $40,423 |
| 2022 | $1,313 | $37,924 | $10,708 | $27,216 |
| 2021 | $1,441 | $37,924 | $10,708 | $27,216 |
| 2020 | $1,472 | $37,924 | $10,708 | $27,216 |
| 2019 | $1,485 | $37,924 | $10,708 | $27,216 |
| 2018 | $2,454 | $37,924 | $10,708 | $27,216 |
| 2017 | $1,421 | $37,924 | $10,708 | $27,216 |
| 2016 | $1,308 | $37,806 | $10,708 | $27,098 |
| 2015 | $1,851 | $37,806 | $10,708 | $27,098 |
| 2014 | $618 | $37,806 | $10,708 | $27,098 |
Source: Public Records
Map
Nearby Homes
- 7135 Bethel Church Rd
- 6100 Clayts Cir
- 6403 Pine Bloom Place
- 6219 Clayts Cir
- 218 Jason Way
- 6408 Michael Dr
- 4360 Chant Ct
- 169 Doublegate Dr
- 173 Doublegate Dr
- 177 Doublegate Dr
- 181 Doublegate Dr
- 169 Hidden Creek Cir
- 5002 Fulton Mill Rd
- 132 Hidden Creek Cir
- 4456 Fulton Mill Rd
- 215 Little Hickory Dr
- 6982 Knoxville Rd
- 6866 Knoxville Rd
- 5265 Dixon We
- 5230 Dixon Rd
- 4014 Sunni Ct
- 4010 Sunni Ct
- 5218 Dixon Rd
- 5270 Dixon Rd
- 5310 Dixon Rd
- 5223 Dixon Rd
- 4011 Sunni Ct
- 4007 Sunni Ct
- 5316 Dixon Rd
- 4004 Sunni Ct
- 5208 Dixon Rd
- 4003 Sunni Ct
- 5213 Dixon Rd
- 6511 Yellowstone Way
- 6515 Yellowstone Way
- 6501 Yellowstone Way
- 5204 Dixon Rd
- 6504 Yellowstone Way