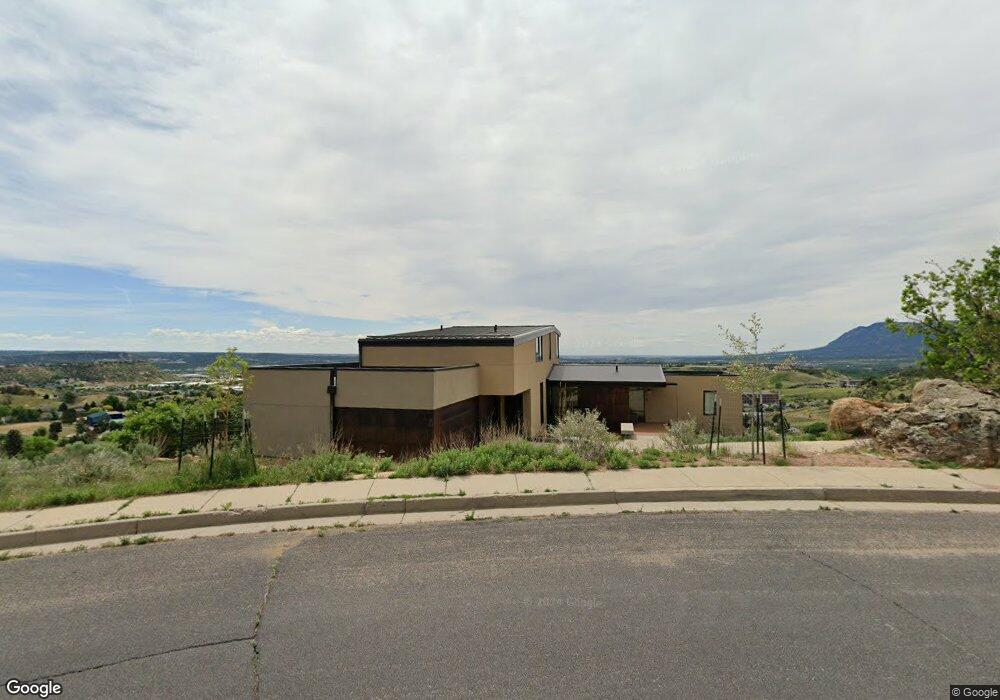
5265 Lanagan St Colorado Springs, CO 80919
Mountain Shadows NeighborhoodEstimated Value: $1,021,000 - $1,225,000
6
Beds
5
Baths
3,417
Sq Ft
$331/Sq Ft
Est. Value
About This Home
This home is located at 5265 Lanagan St, Colorado Springs, CO 80919 and is currently estimated at $1,130,603, approximately $330 per square foot. 5265 Lanagan St is a home located in El Paso County with nearby schools including Chipeta Elementary School, Holmes Middle School, and Coronado High School.
Ownership History
Date
Name
Owned For
Owner Type
Purchase Details
Closed on
Aug 6, 2014
Sold by
Scott Elisabeth
Bought by
Ostly Elisabeth
Current Estimated Value
Purchase Details
Closed on
Dec 13, 2012
Sold by
Miller Elisabeth
Bought by
Scott Elisabeth
Purchase Details
Closed on
Aug 6, 1999
Sold by
Harris Charles L and Harris Loralie M
Bought by
Miller Elisabeth
Purchase Details
Closed on
Oct 23, 1995
Sold by
Klopp A Robert and Klopp Donna J
Bought by
Harris Charles L and Harris Loralie M
Purchase Details
Closed on
Oct 29, 1993
Sold by
Prozan Robert J and Prozan Diane G
Bought by
Klopp A Robert and Klopp Donna J
Purchase Details
Closed on
Mar 2, 1990
Bought by
Ostly Elisabeth
Purchase Details
Closed on
Oct 13, 1989
Bought by
Ostly Elisabeth
Purchase Details
Closed on
Mar 1, 1987
Bought by
Ostly Elisabeth
Create a Home Valuation Report for This Property
The Home Valuation Report is an in-depth analysis detailing your home's value as well as a comparison with similar homes in the area
Home Values in the Area
Average Home Value in this Area
Purchase History
| Date | Buyer | Sale Price | Title Company |
|---|---|---|---|
| Ostly Elisabeth | -- | None Available | |
| Scott Elisabeth | -- | None Available | |
| Miller Elisabeth | $447,000 | First American | |
| Harris Charles L | $430,000 | -- | |
| Klopp A Robert | $314,500 | -- | |
| Ostly Elisabeth | $310,000 | -- | |
| Ostly Elisabeth | $131,000 | -- | |
| Ostly Elisabeth | -- | -- |
Source: Public Records
Tax History Compared to Growth
Tax History
| Year | Tax Paid | Tax Assessment Tax Assessment Total Assessment is a certain percentage of the fair market value that is determined by local assessors to be the total taxable value of land and additions on the property. | Land | Improvement |
|---|---|---|---|---|
| 2025 | $3,605 | $72,320 | -- | -- |
| 2024 | $3,469 | $69,440 | $11,440 | $58,000 |
| 2023 | $3,469 | $69,440 | $11,440 | $58,000 |
| 2022 | $2,662 | $47,570 | $10,320 | $37,250 |
| 2021 | $2,888 | $48,950 | $10,620 | $38,330 |
| 2020 | $3,364 | $49,560 | $9,650 | $39,910 |
| 2019 | $3,346 | $49,560 | $9,650 | $39,910 |
| 2018 | $3,267 | $44,520 | $8,280 | $36,240 |
| 2017 | $3,094 | $44,520 | $8,280 | $36,240 |
| 2016 | $2,467 | $42,550 | $7,960 | $34,590 |
| 2015 | $2,457 | $42,550 | $7,960 | $34,590 |
| 2014 | $2,371 | $46,680 | $7,360 | $39,320 |
Source: Public Records
Map
Nearby Homes
- 5330 Aubrey Way Unit 1
- 2675 Stoneridge Dr
- 2541 Hot Springs Ct
- 5255 Champagne Dr
- 5571 Majestic Dr
- 2275 Ramsgate Terrace
- 5560 Darien Way
- 2145 Ramsgate Terrace
- 2380 Vanreen Dr
- 2425 Green Valley Heights
- 5863 Via Verona View
- 5301 Silverstone Terrace
- 2194 Keara Heights
- 5746 Villa Lorenzo Dr
- 2154 Keara Heights
- 5592 Silverstone Terrace
- 5703 Canyon Reserve Heights
- 5818 Villa Lorenzo Dr
- 5715 Canyon Reserve Heights
- 5775 Regal View Rd
- 5285 Lanagan St
- 5295 Lanagan St
- 5240 Lanagan St
- 5120 Hearthstone Ln
- 5112 Hearthstone Ln
- 5220 Lanagan St
- 5195 Lanagan St
- 5170 Hearthstone Ln
- 5180 Hearthstone Ln
- 5130 Hearthstone Ln
- 5290 Lanagan St
- 5108 Hearthstone Ln
- 5140 Hearthstone Ln
- 2549 Stoneridge Dr
- 5315 Lanagan St
- 5185 Lanagan St
- 5160 Lanagan St
- 5190 Hearthstone Ln
- 5164 Hearthstone Ln
- 2541 Stoneridge Dr