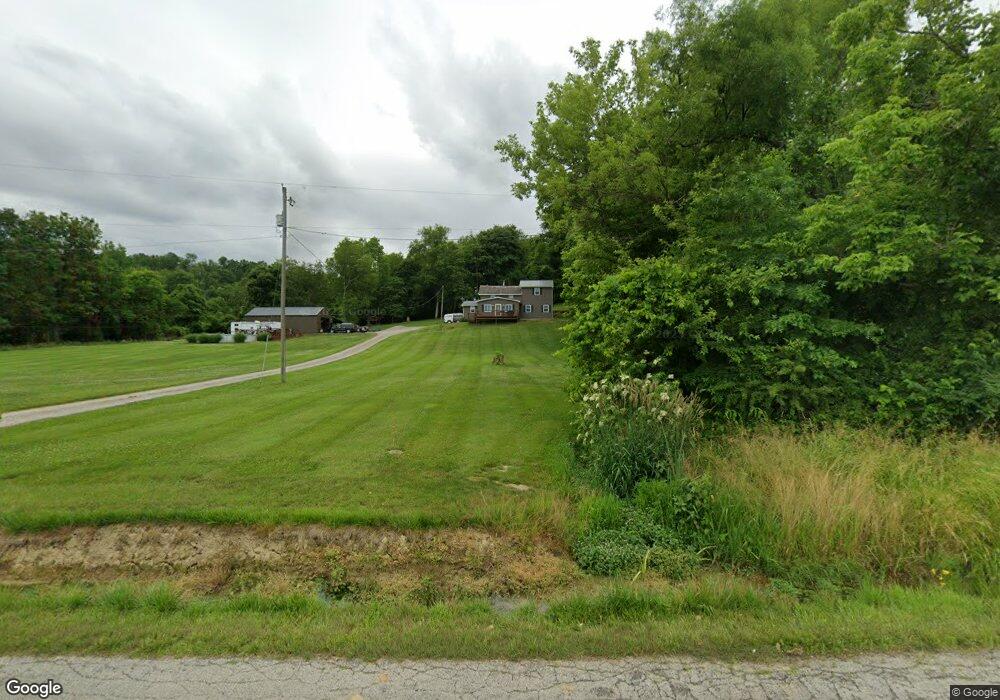
5266 Briarcliff Rd Nashport, OH 43830
Estimated Value: $194,000 - $488,000
5
Beds
1
Bath
2,321
Sq Ft
$128/Sq Ft
Est. Value
About This Home
This home is located at 5266 Briarcliff Rd, Nashport, OH 43830 and is currently estimated at $297,200, approximately $128 per square foot. 5266 Briarcliff Rd is a home located in Licking County with nearby schools including Licking Valley Elementary School, Licking Valley Middle School, and Licking Valley High School.
Ownership History
Date
Name
Owned For
Owner Type
Purchase Details
Closed on
Oct 4, 2019
Sold by
Lane Michael E and Lane Cynthia A
Bought by
Wetzel Seth A
Current Estimated Value
Home Financials for this Owner
Home Financials are based on the most recent Mortgage that was taken out on this home.
Original Mortgage
$77,330
Outstanding Balance
$68,249
Interest Rate
3.87%
Mortgage Type
FHA
Estimated Equity
$228,951
Purchase Details
Closed on
May 20, 2015
Sold by
Proffit Steven Ray
Bought by
Lane Michael E and Lane Cynthia A
Purchase Details
Closed on
Jul 30, 2008
Sold by
Bruner Land Co Inc
Bought by
Proffit Steven Ray
Home Financials for this Owner
Home Financials are based on the most recent Mortgage that was taken out on this home.
Original Mortgage
$39,736
Interest Rate
6.51%
Mortgage Type
Seller Take Back
Create a Home Valuation Report for This Property
The Home Valuation Report is an in-depth analysis detailing your home's value as well as a comparison with similar homes in the area
Home Values in the Area
Average Home Value in this Area
Purchase History
| Date | Buyer | Sale Price | Title Company |
|---|---|---|---|
| Wetzel Seth A | $120,000 | None Available | |
| Lane Michael E | $87,000 | None Available | |
| Proffit Steven Ray | $48,900 | Lawyers Tit |
Source: Public Records
Mortgage History
| Date | Status | Borrower | Loan Amount |
|---|---|---|---|
| Open | Wetzel Seth A | $77,330 | |
| Previous Owner | Proffit Steven Ray | $39,736 |
Source: Public Records
Tax History Compared to Growth
Tax History
| Year | Tax Paid | Tax Assessment Tax Assessment Total Assessment is a certain percentage of the fair market value that is determined by local assessors to be the total taxable value of land and additions on the property. | Land | Improvement |
|---|---|---|---|---|
| 2024 | $2,032 | $61,010 | $23,520 | $37,490 |
| 2023 | $2,095 | $61,010 | $23,520 | $37,490 |
| 2022 | $1,569 | $41,440 | $14,000 | $27,440 |
| 2021 | $1,606 | $41,440 | $14,000 | $27,440 |
| 2020 | $1,606 | $41,440 | $14,000 | $27,440 |
| 2019 | $1,379 | $33,150 | $11,200 | $21,950 |
| 2018 | $1,385 | $0 | $0 | $0 |
| 2017 | $1,240 | $0 | $0 | $0 |
| 2016 | $1,103 | $0 | $0 | $0 |
| 2015 | $1,091 | $0 | $0 | $0 |
| 2014 | $506 | $0 | $0 | $0 |
| 2013 | $9,214 | $0 | $0 | $0 |
Source: Public Records
Map
Nearby Homes
- 4287 Dragoo Rd
- 4338 Briarcliff Rd
- 6255 Licking Valley Rd
- 3615 Dragoo Rd
- 0 Briarcliff Rd
- 9913 Perryton Rd
- 19121 Marne Rd
- 9360 Black Run Rd
- 12375 Hamby Hill Rd
- 3286 Licking Valley Rd NE
- 0 Briarcliff Rd Unit LotWP001
- 9360 Black Run Rd
- 17930 Bear Rd
- 13066 Hamby Hill Rd
- 10315 Marne Rd
- 10345 Marne Rd
- 9280 Lentz Rd
- 8236 Pleasant Valley Rd NE
- 8855 Ashcraft Rd
- 8236 Pleasant Valley Rd
- 5335 Briarcliff Rd
- 5129 Evans Rd
- 5304 Briarcliff Rd
- 5344 Briarcliff Rd
- 5105 Evans Rd
- 5361 Briarcliff Rd
- 5201 Briarcliff Rd
- 5050 Briarcliff Rd
- 5429 Briarcliff Rd
- 5105 Pleasant Valley Rd NE
- 5484 Briarcliff Rd
- 5022 Briarcliff Rd
- 5043 Pleasant Valley Rd
- 5049 Briarcliff Rd
- 4920 Briarcliff Rd
- 0 Pleasant Valley Rd Unit 2905999
- 5469 Briarcliff Rd
- 4980 Pleasant Valley Rd NE
- 4978 Pleasant Valley Rd
- 4980 Pleasant Valley Rd