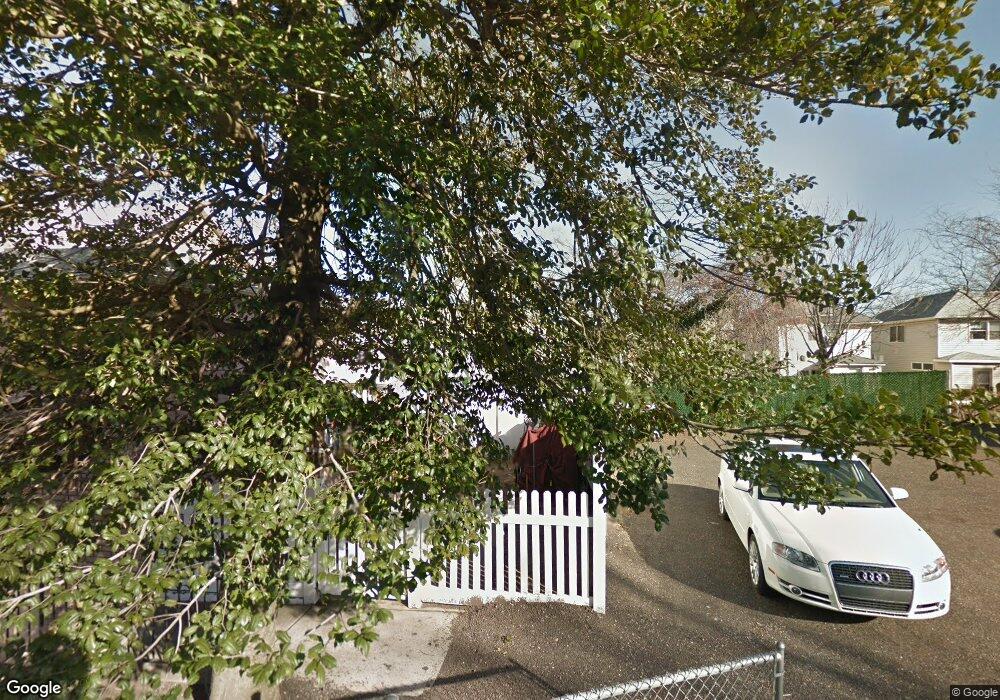
5268-5270 Arthur Kill Rd Staten Island, NY 10307
Tottenville NeighborhoodEstimated Value: $1,128,633
--
Bed
--
Bath
5,850
Sq Ft
$193/Sq Ft
Est. Value
About This Home
This home is located at 5268-5270 Arthur Kill Rd, Staten Island, NY 10307 and is currently estimated at $1,128,633, approximately $192 per square foot. 5268-5270 Arthur Kill Rd is a home located in Richmond County with nearby schools including P.S. 1 Tottenville, Is 34 Tottenville, and Tottenville High School.
Ownership History
Date
Name
Owned For
Owner Type
Purchase Details
Closed on
Oct 12, 2017
Sold by
Saf Realty Llc
Bought by
Rendatt Llc
Current Estimated Value
Home Financials for this Owner
Home Financials are based on the most recent Mortgage that was taken out on this home.
Original Mortgage
$600,000
Outstanding Balance
$153,477
Interest Rate
5.5%
Mortgage Type
Seller Take Back
Estimated Equity
$975,156
Purchase Details
Closed on
Mar 24, 2004
Sold by
Saf Realty Corp
Bought by
Saf Realty Llc
Purchase Details
Closed on
Mar 26, 1999
Sold by
Saf Realty Corp
Bought by
Adm Building Associates Corp
Home Financials for this Owner
Home Financials are based on the most recent Mortgage that was taken out on this home.
Original Mortgage
$140,000
Interest Rate
6.9%
Mortgage Type
Seller Take Back
Create a Home Valuation Report for This Property
The Home Valuation Report is an in-depth analysis detailing your home's value as well as a comparison with similar homes in the area
Home Values in the Area
Average Home Value in this Area
Purchase History
| Date | Buyer | Sale Price | Title Company |
|---|---|---|---|
| Rendatt Llc | $820,000 | Homestead Title Agency | |
| Saf Realty Llc | -- | -- | |
| Adm Building Associates Corp | $240,000 | -- |
Source: Public Records
Mortgage History
| Date | Status | Borrower | Loan Amount |
|---|---|---|---|
| Open | Rendatt Llc | $600,000 | |
| Previous Owner | Adm Building Associates Corp | $140,000 |
Source: Public Records
Tax History Compared to Growth
Tax History
| Year | Tax Paid | Tax Assessment Tax Assessment Total Assessment is a certain percentage of the fair market value that is determined by local assessors to be the total taxable value of land and additions on the property. | Land | Improvement |
|---|---|---|---|---|
| 2025 | $24,000 | $256,050 | $96,194 | $159,856 |
| 2024 | $24,000 | $213,300 | $106,920 | $106,380 |
| 2023 | $21,805 | $177,750 | $142,921 | $34,829 |
| 2022 | $24,225 | $198,000 | $118,800 | $79,200 |
| 2021 | $28,594 | $233,100 | $118,800 | $114,300 |
| 2020 | $40,773 | $233,100 | $118,800 | $114,300 |
| 2019 | $40,896 | $291,240 | $118,800 | $172,440 |
| 2018 | $34,663 | $272,526 | $88,933 | $183,593 |
| 2017 | $33,046 | $259,815 | $92,316 | $167,499 |
| 2016 | $31,014 | $240,570 | $106,920 | $133,650 |
| 2015 | $28,087 | $222,750 | $118,800 | $103,950 |
| 2014 | $28,087 | $213,673 | $113,959 | $99,714 |
Source: Public Records
Map
Nearby Homes
- 5265 Arthur Kill Rd
- 397 Ellis St
- 133 Fisher Ave
- 147 Wood Ave
- 5362 Arthur Kill Rd
- 197 Craig Ave
- 42 Girard St
- 217-219 Fisher Ave
- 140 Craig Ave
- 112 Johnson Ave
- 233 Fisher Ave
- 69 Nashville St
- 46 Parker St
- 7372 Amboy Rd
- 133 Butler Ave
- 7036 Amboy Rd
- 137 Butler Ave
- 141 Butler Ave
- 21 Sprague Ave
- 5463 Arthur Kill Rd Unit 5465
- 5262 Arthur Kill Rd
- 5266 Arthur Kill Rd
- 5256 Arthur Kill Rd Unit 5258
- 5256 Arthur Kill Rd Unit 5256-58
- 5256 Arthur Kill Rd
- 5258 Arthur Kill Rd
- 5254 Arthur Kill Rd
- 5267 Arthur Kill Rd Unit A
- 5267 Arthur Kill Rd Unit B
- 5267 Arthur Kill Rd Unit C
- 5267 Arthur Kill Rd
- 5252 Arthur Kill Rd Unit 5254
- 5252 Arthur Kill Rd Unit 5252-54
- 5252 Arthur Kill Rd
- 5271 Arthur Kill Rd Unit 5275
- 5271 Arthur Kill Rd
- 5257 Arthur Kill Rd
- 5272 Arthur Kill Rd
- 110 Fisher Ave
- 5278 Arthur Kill Rd