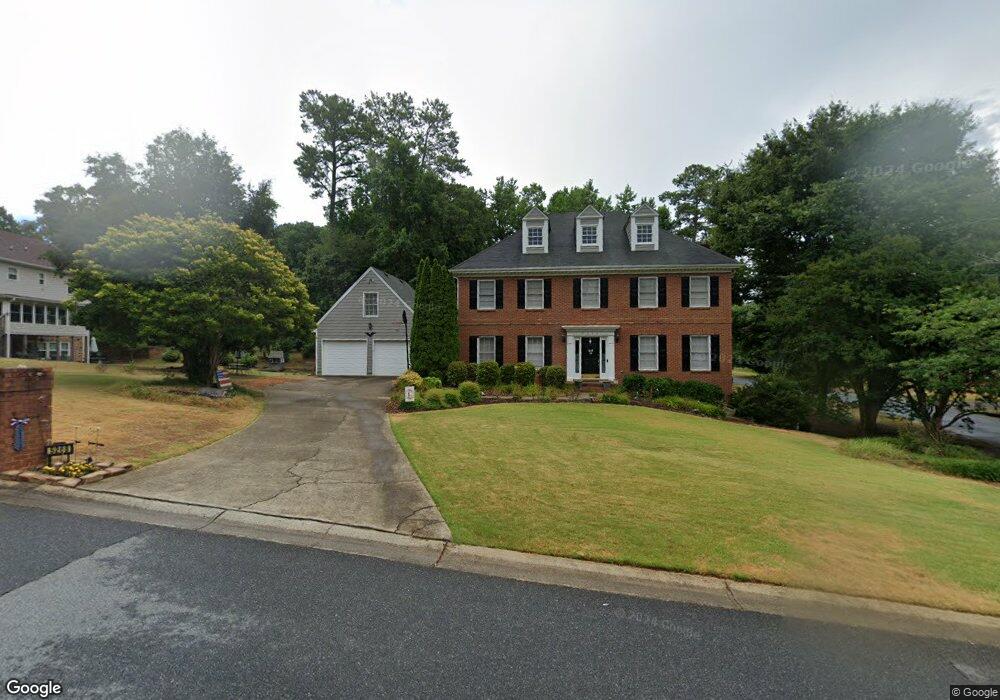
5268 Fox Hill Ct Norcross, GA 30092
Estimated Value: $610,560 - $852,000
4
Beds
3
Baths
2,924
Sq Ft
$246/Sq Ft
Est. Value
About This Home
This home is located at 5268 Fox Hill Ct, Norcross, GA 30092 and is currently estimated at $718,140, approximately $245 per square foot. 5268 Fox Hill Ct is a home located in Gwinnett County with nearby schools including Simpson Elementary School, Pinckneyville Middle School, and Norcross High School.
Ownership History
Date
Name
Owned For
Owner Type
Purchase Details
Closed on
Aug 28, 2009
Sold by
Wedean Properties Inc
Bought by
Lee David D and Lee Sonia M
Current Estimated Value
Home Financials for this Owner
Home Financials are based on the most recent Mortgage that was taken out on this home.
Original Mortgage
$272,000
Outstanding Balance
$176,075
Interest Rate
5.15%
Mortgage Type
New Conventional
Estimated Equity
$542,065
Purchase Details
Closed on
May 5, 2009
Sold by
Berhannan Steven A and Berhannan Rachel E
Bought by
Wedean Properties Inc
Purchase Details
Closed on
Jan 9, 1995
Sold by
Newmann Roger L Lorelei P
Bought by
Berhannan Steven A Rachel E
Home Financials for this Owner
Home Financials are based on the most recent Mortgage that was taken out on this home.
Original Mortgage
$196,400
Interest Rate
9.2%
Create a Home Valuation Report for This Property
The Home Valuation Report is an in-depth analysis detailing your home's value as well as a comparison with similar homes in the area
Home Values in the Area
Average Home Value in this Area
Purchase History
| Date | Buyer | Sale Price | Title Company |
|---|---|---|---|
| Lee David D | $340,000 | -- | |
| Wedean Properties Inc | $182,999 | -- | |
| Berhannan Steven A Rachel E | $206,800 | -- |
Source: Public Records
Mortgage History
| Date | Status | Borrower | Loan Amount |
|---|---|---|---|
| Open | Lee David D | $272,000 | |
| Previous Owner | Berhannan Steven A Rachel E | $196,400 |
Source: Public Records
Tax History Compared to Growth
Tax History
| Year | Tax Paid | Tax Assessment Tax Assessment Total Assessment is a certain percentage of the fair market value that is determined by local assessors to be the total taxable value of land and additions on the property. | Land | Improvement |
|---|---|---|---|---|
| 2025 | $6,029 | $248,640 | $38,000 | $210,640 |
| 2024 | $6,415 | $222,760 | $32,000 | $190,760 |
| 2023 | $6,415 | $222,760 | $32,000 | $190,760 |
| 2022 | $5,710 | $241,240 | $32,000 | $209,240 |
| 2021 | $5,834 | $188,160 | $27,760 | $160,400 |
| 2020 | $5,876 | $188,160 | $27,760 | $160,400 |
| 2019 | $5,458 | $176,320 | $28,000 | $148,320 |
| 2018 | $5,188 | $162,960 | $24,000 | $138,960 |
| 2016 | $4,398 | $128,640 | $24,000 | $104,640 |
| 2015 | $4,449 | $128,640 | $24,000 | $104,640 |
| 2014 | -- | $128,640 | $24,000 | $104,640 |
Source: Public Records
Map
Nearby Homes
- 5354 Fox Hill Dr
- 5397 Valley Mist Ct
- 5221 W Jones Bridge Rd
- 5350 Wickershire Dr
- 4916 Sudbrook Way Unit 253
- The Adams Plan at Waterside - Condos
- 4457 Watervale Way Unit 292
- 4477 Watervale Way Unit 286
- 5047 Shirley Oaks Dr Unit 313
- 4903 Sudbrook Way Unit 239
- The Stanley Plan at Waterside - Single Family
- The Stafford Plan at Waterside - Single Family
- 5039 Shirley Oaks Dr Unit 315
- 4479 Watervale Way Unit 285
- 5059 Shirley Oaks Dr Unit 309
- The Barrett II Plan at Waterside - Condos
- The Benton II Plan at Waterside - Townhomes
- 5134 Bandolino Ln Unit 320
- The Cascade Plan at Waterside - Condos
- The Grayson II Plan at Waterside - Single Family
- 5258 Fox Hill Ct Unit 30%
- 5258 Fox Hill Ct
- 5335 Fox Hill Dr Unit 2
- 5258 Fox Hill Ct
- 0 Fox Hill Ct NW Unit 3264695
- 5228 Fox Hill Ct
- 5375 Fox Hill Dr
- 5364 Fox Hill Dr Unit 2
- 5344 Fox Hill Dr
- 5325 Fox Hill Dr
- 5218 Fox Hill Ct Unit 2
- 5374 Fox Hill Dr
- 5334 Fox Hill Dr
- 5257 Fox Hill Ct
- 5385 Fox Hill Dr
- 5384 Fox Hill Dr
- 5324 Fox Hill Dr Unit 2
- 5237 Fox Hill Ct
- 5247 Fox Hill Ct Unit 2
- 5305 Fox Hill Dr