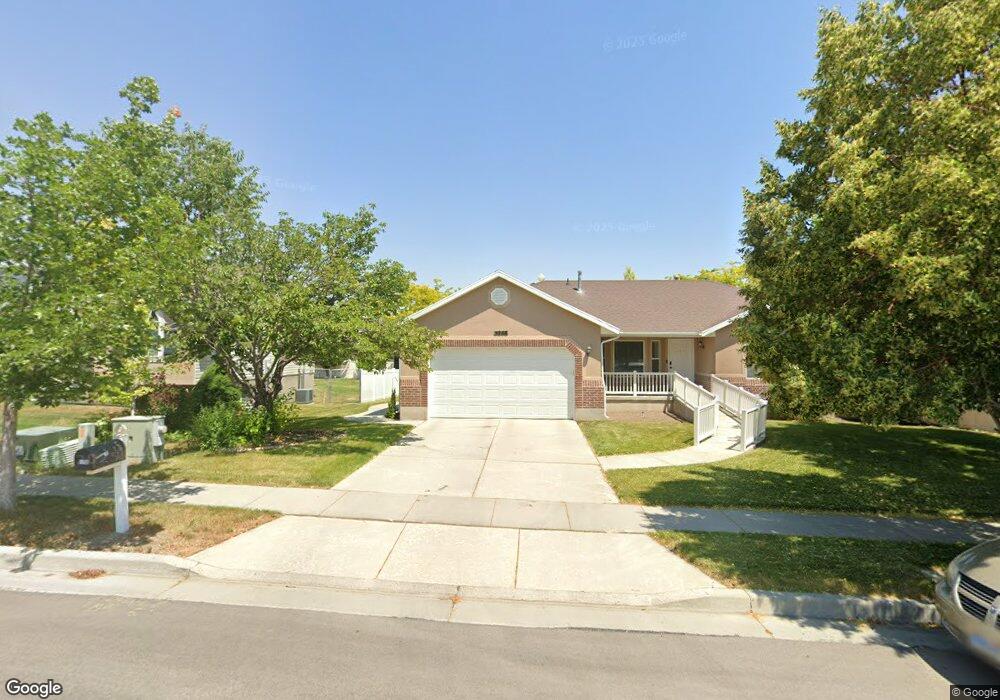
5268 Shaggy Peak Dr Riverton, UT 84096
Estimated Value: $612,809 - $646,000
3
Beds
2
Baths
2,416
Sq Ft
$262/Sq Ft
Est. Value
About This Home
This home is located at 5268 Shaggy Peak Dr, Riverton, UT 84096 and is currently estimated at $633,452, approximately $262 per square foot. 5268 Shaggy Peak Dr is a home located in Salt Lake County with nearby schools including Foothills School, South Hills Middle School, and Mountain Ridge High School.
Ownership History
Date
Name
Owned For
Owner Type
Purchase Details
Closed on
Apr 1, 2015
Sold by
Clark Francis T and Clark Patricia T
Bought by
Clark Patricia J
Current Estimated Value
Home Financials for this Owner
Home Financials are based on the most recent Mortgage that was taken out on this home.
Original Mortgage
$47,000
Outstanding Balance
$35,956
Interest Rate
3.57%
Mortgage Type
Credit Line Revolving
Estimated Equity
$597,496
Purchase Details
Closed on
Oct 4, 2010
Sold by
Pike Patrick S
Bought by
Pike Patrick S and Pike Wendy
Home Financials for this Owner
Home Financials are based on the most recent Mortgage that was taken out on this home.
Original Mortgage
$249,183
Outstanding Balance
$164,602
Interest Rate
4.37%
Mortgage Type
FHA
Estimated Equity
$468,850
Purchase Details
Closed on
May 23, 2001
Sold by
Pike Patrick
Bought by
Pike Patrick and Pike Wendy
Home Financials for this Owner
Home Financials are based on the most recent Mortgage that was taken out on this home.
Original Mortgage
$174,800
Interest Rate
7.06%
Create a Home Valuation Report for This Property
The Home Valuation Report is an in-depth analysis detailing your home's value as well as a comparison with similar homes in the area
Home Values in the Area
Average Home Value in this Area
Purchase History
| Date | Buyer | Sale Price | Title Company |
|---|---|---|---|
| Clark Patricia J | -- | None Available | |
| Pike Patrick S | -- | Metro National Title | |
| Pike Patrick S | -- | Metro National Title | |
| Pike Patrick | -- | Founders Title Company | |
| Pike Patrick | -- | Founders Title |
Source: Public Records
Mortgage History
| Date | Status | Borrower | Loan Amount |
|---|---|---|---|
| Open | Clark Patricia J | $47,000 | |
| Open | Pike Patrick S | $249,183 | |
| Closed | Pike Patrick | $174,800 |
Source: Public Records
Tax History Compared to Growth
Tax History
| Year | Tax Paid | Tax Assessment Tax Assessment Total Assessment is a certain percentage of the fair market value that is determined by local assessors to be the total taxable value of land and additions on the property. | Land | Improvement |
|---|---|---|---|---|
| 2025 | $3,233 | $594,100 | $195,600 | $398,500 |
| 2024 | $3,233 | $559,500 | $179,700 | $379,800 |
| 2023 | $3,419 | $557,800 | $166,400 | $391,400 |
| 2022 | $3,524 | $564,100 | $163,100 | $401,000 |
| 2021 | $2,929 | $417,400 | $125,800 | $291,600 |
| 2020 | $2,834 | $376,600 | $97,900 | $278,700 |
| 2019 | $2,712 | $354,200 | $93,200 | $261,000 |
| 2018 | $2,595 | $333,700 | $86,100 | $247,600 |
| 2017 | $2,472 | $309,900 | $86,100 | $223,800 |
| 2016 | $2,367 | $284,700 | $86,100 | $198,600 |
| 2015 | $2,190 | $255,300 | $86,200 | $169,100 |
| 2014 | $2,106 | $240,700 | $82,100 | $158,600 |
Source: Public Records
Map
Nearby Homes
- 14032 Lewiston Peak Dr
- 5288 Shaggy Peak Dr
- 13908 S 5180 W
- 14054 Elk Horn Peak Dr
- 5248 Little Water Peak Dr
- 13878 S Shaggy Peak Dr
- 14048 van Cott Peak Cir
- 14121 Elk Horn Peak Dr
- 14049 S van Cott Peak Cir
- 5036 W Cedar Point Peak Dr
- 5030 Little Water Peak Dr
- 14254 S Amber Rose Ln
- 14322 Pepper Grass Ln
- 14347 S Mount Ogden Peak Dr
- 14242 S Crown Rose Dr
- 14311 Prairie Dawn Ln
- 5613 Prospero Ln
- 13842 Pioneer Peak Cir
- 13863 S Kessler Peak Dr
- 5418 W Morning Light Dr
- 5254 Shaggy Peak Dr
- 5278 Shaggy Peak Dr
- 5278 W Shaggy Peak Dr
- 5280 Shaggy Peak Dr
- 5257 W Majestic Peak Dr
- 5257 Majestic Peak Dr
- 5271 W Majestic Peak Dr
- 5271 Majestic Peak Dr
- 5244 W Shaggy Peak Dr
- 5244 Shaggy Peak Dr
- 5288 W Shaggy Peak Dr
- 5251 Majestic Peak Dr
- 5251 W Majestic Peak Dr
- 14032 S Lewiston Peak Dr
- 5287 Majestic Peak Dr
- 14033 Lightening Peak Dr
- 5232 Shaggy Peak Dr
- 14033 Lewiston Peak Dr
- 5231 W Majestic Peak Dr
- 5231 Majestic Peak Dr