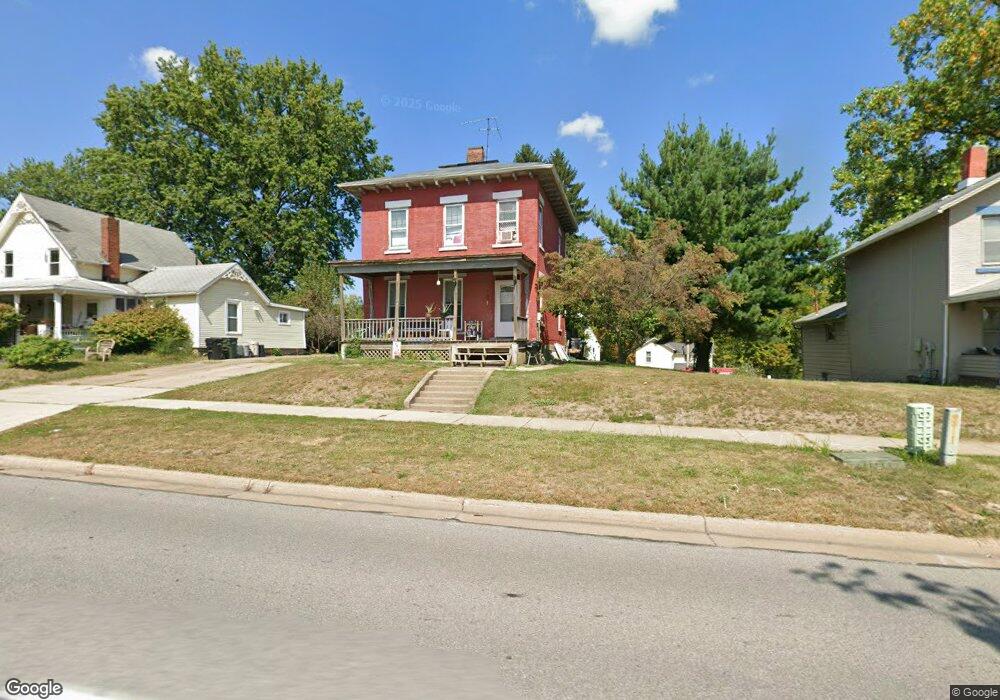
527 3rd St Elyria, OH 44035
Estimated Value: $107,100 - $164,000
3
Beds
2
Baths
1,568
Sq Ft
$79/Sq Ft
Est. Value
About This Home
This home is located at 527 3rd St, Elyria, OH 44035 and is currently estimated at $124,525, approximately $79 per square foot. 527 3rd St is a home located in Lorain County with nearby schools including Eastern Heights Middle School, Elyria High School, and St Mary Elementary School.
Ownership History
Date
Name
Owned For
Owner Type
Purchase Details
Closed on
May 11, 2023
Sold by
Gordon Kenneth J and Gordon Robin
Bought by
Gordon Stacey Kara
Current Estimated Value
Purchase Details
Closed on
Aug 2, 2021
Sold by
Morton Kimberly A and Kaminski Lawrence J
Bought by
Gordon Kenneth J and Gordon Robin
Home Financials for this Owner
Home Financials are based on the most recent Mortgage that was taken out on this home.
Original Mortgage
$75,000
Interest Rate
2.93%
Mortgage Type
Credit Line Revolving
Purchase Details
Closed on
Jun 21, 2011
Sold by
Morton Kimberly A and Morton Randolph
Bought by
Kaminski Lawrence J
Purchase Details
Closed on
Apr 30, 2008
Sold by
Kaminski Lawrence J and Kaminski Sylvia
Bought by
Morton Kimberly A
Purchase Details
Closed on
Feb 22, 2001
Sold by
Wellman Robert T
Bought by
Kaminski Lawrence J
Create a Home Valuation Report for This Property
The Home Valuation Report is an in-depth analysis detailing your home's value as well as a comparison with similar homes in the area
Home Values in the Area
Average Home Value in this Area
Purchase History
| Date | Buyer | Sale Price | Title Company |
|---|---|---|---|
| Gordon Stacey Kara | -- | None Listed On Document | |
| Gordon Kenneth J | $14,000 | Old Republic Title | |
| Kaminski Lawrence J | -- | Attorney | |
| Morton Kimberly A | -- | Attorney | |
| Kaminski Lawrence J | $16,500 | -- |
Source: Public Records
Mortgage History
| Date | Status | Borrower | Loan Amount |
|---|---|---|---|
| Previous Owner | Gordon Kenneth J | $75,000 |
Source: Public Records
Tax History
| Year | Tax Paid | Tax Assessment Tax Assessment Total Assessment is a certain percentage of the fair market value that is determined by local assessors to be the total taxable value of land and additions on the property. | Land | Improvement |
|---|---|---|---|---|
| 2024 | $1,130 | $23,310 | $10,084 | $13,227 |
| 2023 | $569 | $9,902 | $4,431 | $5,471 |
| 2022 | $551 | $9,902 | $4,431 | $5,471 |
| 2021 | $552 | $9,902 | $4,431 | $5,471 |
| 2020 | $531 | $8,470 | $3,790 | $4,680 |
| 2019 | $560 | $8,470 | $3,790 | $4,680 |
| 2018 | $781 | $13,140 | $3,790 | $9,350 |
| 2017 | $684 | $10,500 | $3,350 | $7,150 |
| 2016 | $675 | $10,500 | $3,350 | $7,150 |
| 2015 | $760 | $12,590 | $3,350 | $9,240 |
| 2014 | $751 | $12,590 | $3,350 | $9,240 |
| 2013 | $744 | $12,590 | $3,350 | $9,240 |
Source: Public Records
Map
Nearby Homes
Your Personal Tour Guide
Ask me questions while you tour the home.