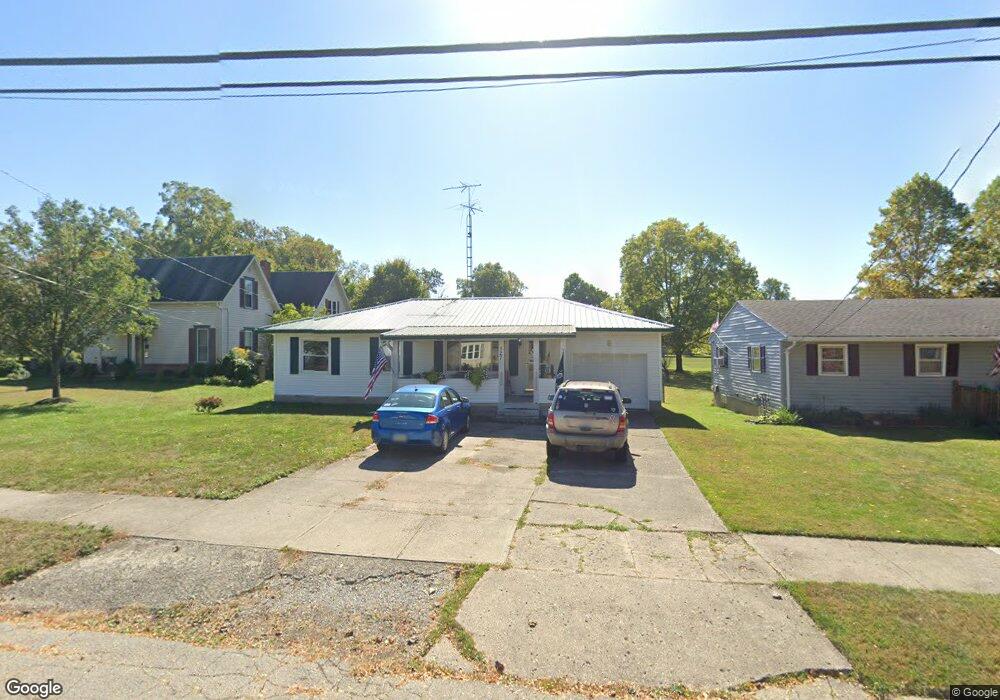
527 Boyce St Urbana, OH 43078
Estimated Value: $189,110 - $201,000
3
Beds
2
Baths
1,064
Sq Ft
$182/Sq Ft
Est. Value
About This Home
This home is located at 527 Boyce St, Urbana, OH 43078 and is currently estimated at $193,528, approximately $181 per square foot. 527 Boyce St is a home located in Champaign County with nearby schools including Urbana Elementary School, Urbana High School, and Urbana Community School.
Ownership History
Date
Name
Owned For
Owner Type
Purchase Details
Closed on
Aug 23, 2012
Sold by
Hays Thomas J
Bought by
Hays Thomas J and Hays Linda C
Current Estimated Value
Home Financials for this Owner
Home Financials are based on the most recent Mortgage that was taken out on this home.
Original Mortgage
$17,500
Interest Rate
3.54%
Mortgage Type
Future Advance Clause Open End Mortgage
Purchase Details
Closed on
Apr 27, 2011
Sold by
Hays Linda C and Hays Thomas J
Bought by
Hays Linda C and Hays Thomas J
Create a Home Valuation Report for This Property
The Home Valuation Report is an in-depth analysis detailing your home's value as well as a comparison with similar homes in the area
Home Values in the Area
Average Home Value in this Area
Purchase History
| Date | Buyer | Sale Price | Title Company |
|---|---|---|---|
| Hays Thomas J | -- | None Available | |
| Hays Linda C | -- | Attorney |
Source: Public Records
Mortgage History
| Date | Status | Borrower | Loan Amount |
|---|---|---|---|
| Closed | Hays Thomas J | $17,500 |
Source: Public Records
Tax History Compared to Growth
Tax History
| Year | Tax Paid | Tax Assessment Tax Assessment Total Assessment is a certain percentage of the fair market value that is determined by local assessors to be the total taxable value of land and additions on the property. | Land | Improvement |
|---|---|---|---|---|
| 2024 | $1,131 | $37,300 | $6,640 | $30,660 |
| 2023 | $1,131 | $37,300 | $6,640 | $30,660 |
| 2022 | $1,198 | $37,300 | $6,640 | $30,660 |
| 2021 | $955 | $28,930 | $5,320 | $23,610 |
| 2020 | $955 | $28,930 | $5,320 | $23,610 |
| 2019 | $944 | $28,930 | $5,320 | $23,610 |
| 2018 | $855 | $26,220 | $4,570 | $21,650 |
| 2017 | $849 | $26,220 | $4,570 | $21,650 |
| 2016 | $851 | $26,220 | $4,570 | $21,650 |
| 2015 | $825 | $25,190 | $4,570 | $20,620 |
| 2014 | $826 | $25,190 | $4,570 | $20,620 |
| 2013 | $702 | $25,190 | $4,570 | $20,620 |
Source: Public Records
Map
Nearby Homes